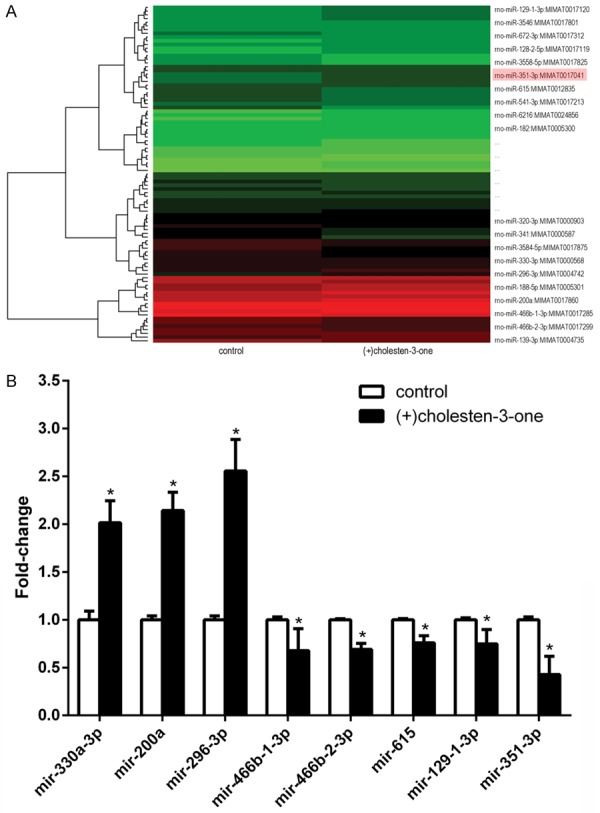
Figure 1.

The cluster diagram and bar graph of differential miRNA were illustrated after (+)-cholesten-3-one-induced MSCs osteogenic differentiation for 3 days. A. Compared with control group, there were 52 miRNA up-regulated and 55 down-regulated in (+)-cholesten-3-one induction group. In the microarray cluster diagram, red color represents the miRNAs expression were in relatively high quantity, and green means relatively low. Especially, the data of some miRNA were nearly to limits line. B. We collected significantly (like miR-351-3p), but which we certified with the following qRT-PCR. The fold-change value of miRNA in osteogenic induction group compared with control group. In the total database of miRNA microarray, we made further screening and selected some possible miRNA to identify with qRT-PCR. *p<0.05 versus control group.
