Figure 1.

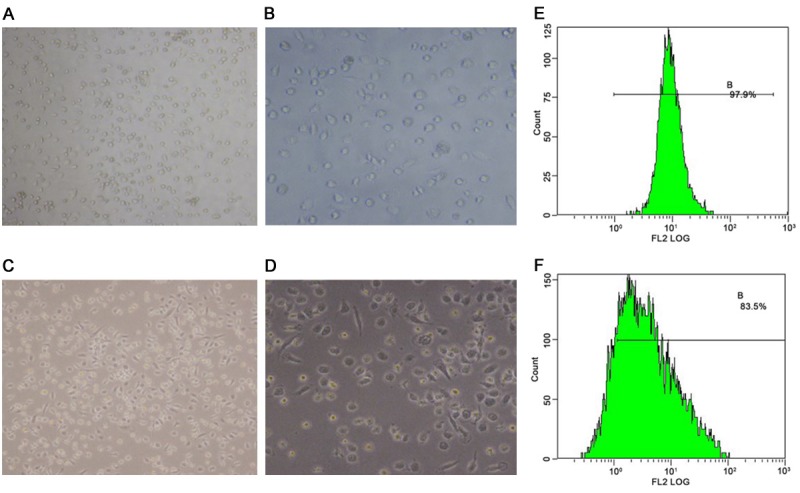
Cell morphological observation and phenotype identification by PAS. (A) Mononuclear cells (×100 magnification), (B) mononuclear cells (×200 magnification), (C) M2 macrophages (×100 magnification), (D) M2 macrophages (×200 magnification), (E) CD14+ mononuclear cells, and (F) percentage of M2 macrophages (CD163+).
