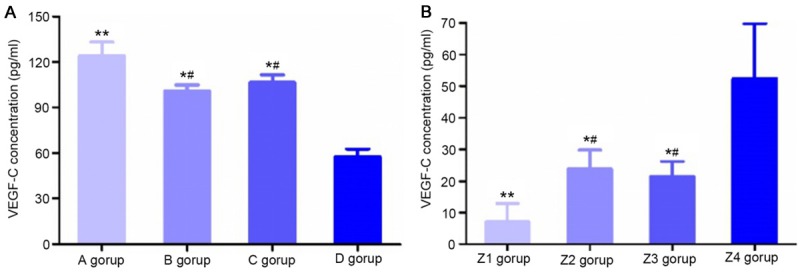
Figure 6.

Determination of VEGF-C concentration. A: VEGF-C concentrations (pg/ml) in conditioned culture medium of different groups. **P<0.01, compared with group D; *P<0.05, compared with group D; #P<0.05, compared with group A. (A) Mixed culture medium group, (B) M2 macrophage group, (C) KYSE150 group, and (D) control group. B: After transfection, VEGF-C concentrations (pg/ml) in conditioned culture media of different groups. **P<0.01, compared with group Z4; *P<0.05, compared with group Z4; #P<0.05, compared with group Z1. (Z1) Post-transfection mixed culture medium group, (Z2) post-transfection M2 macrophage group, (Z3) post-transfection KYSE150 group, and (Z4) control group.
