
Figure 4.
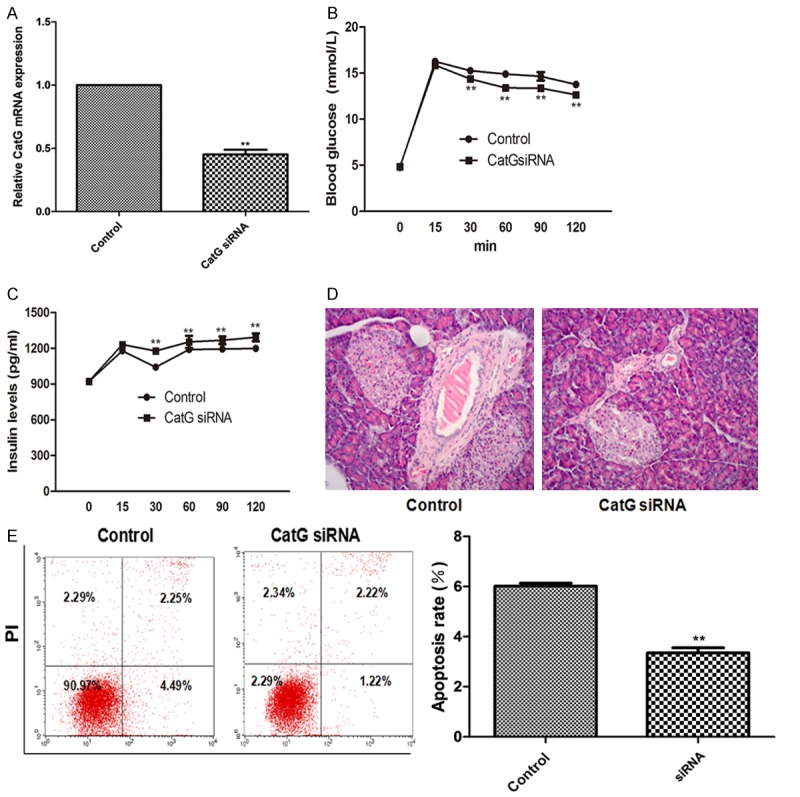
Effect of CatG siRNA on the blood glucose, insulin levels and β cell apoptosis in NOD mice. A. Relative GatG mRNA level; B and C. Blood glucose and insulin levels over time; D. Islet H&E staining; E. Flow cytometry assay and percentage of apoptosis. ** Denotes P < 0.01 vs control.