
Figure 5.
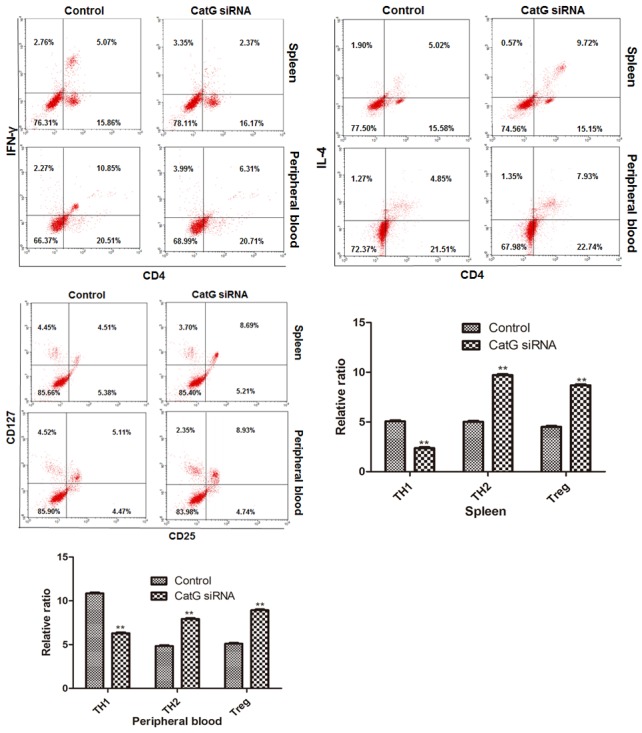
Effect of CatG siRNA treatment on the activation of CD4+ T cells in pre-DM NOD mice. Upper panel: cytometry assay of T cells, lower panel: percentage of CD4+ T subsets in spleen and peripheral blood. ** Denotes P < 0.01 vs control.
Official websites use .gov
A
.gov website belongs to an official
government organization in the United States.
Secure .gov websites use HTTPS
A lock (
) or https:// means you've safely
connected to the .gov website. Share sensitive
information only on official, secure websites.
Effect of CatG siRNA treatment on the activation of CD4+ T cells in pre-DM NOD mice. Upper panel: cytometry assay of T cells, lower panel: percentage of CD4+ T subsets in spleen and peripheral blood. ** Denotes P < 0.01 vs control.