Fig. 8.
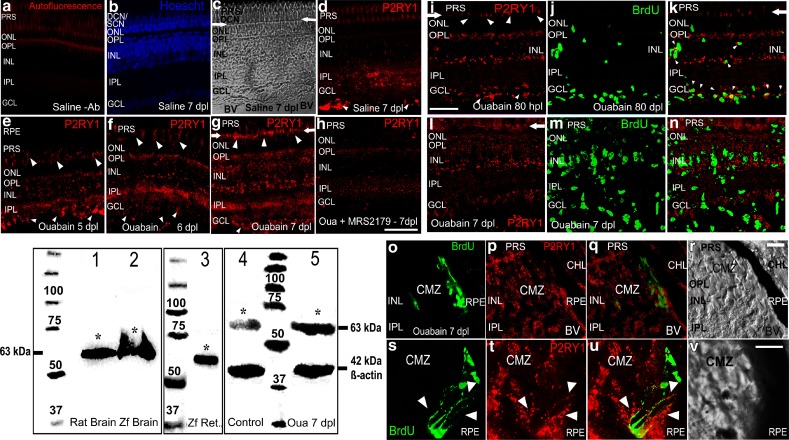
P2RY1 protein expression and localization in intact or injured retina layers. Western blot depicts P2RY1 immunodetection in the homogenates of rat and zebrafish brain which is shown in lanes 1 and 2, whereas homogenates of zebrafish neural retinas were loaded in lane 3. Lanes 4 and 5 show P2RY1 immunodetection in homogenates of saline- and ouabain-treated retinas examined 7 days after injury. Proteins from the brain (25 μg/lane) and neural retina (70 μg/lane) were separated by sodium dodecyl sulphate-polyacrylamide gel electrophoresis (SDS-PAGE) in reducing conditions, transferred to nitrocellulose membranes and incubated with antibodies. The asterisks label bands of apparent molecular weight of 63 kDa detected with the P2RY1 antibody. The bands of 42 kDa in lanes 4 and 5 were detected using an anti-β-actin antibody. Numbers 25–100 indicate molecular weights of proteins of a standard marker. Data were obtained from three to four retina pools (ten retinas each) and independent assays. Representative confocal images of retina sections from zebrafish show the expression of P2RY1 (in red) as detected by fluorescence immunocytochemistry (FICC). a A representative image of an injured retina section incubated without P2RY1 primary antibody (Ab, negative control). b–d Saline-treated uninjured retina sections stained with Hoechst to show nuclear layers (b) and two images of the same microscopic field. These pictures were taken using a transmitted irradiance channel and differential interference contrast (DIC) filters in c and the corresponding confocal image of the P2RY1 fluorescent immunoreactivity (IR) in d. Pictures in e–g depict images of mature retina sections 5, 6, and 7 days after lesion (dpl). The image in h shows P2RY1-IR in an injured-retina treated in vivo for 6 days with the antagonist MRS2179. Blurry and even red labelling in the photoreceptor segments represents autofluorescence that was also exhibited by negative control sections. Detection of 5-bromo-2′-deoxyuridine (BrdU) by FICC appears as bright green nuclei. BrdU was injected 4 h before euthanasia at the indicated intervals after lesion (i–v). Small arrowheads in d–g indicate P2RY1 strong IR in structures that likely are blood vessels. Arrows in c, d, g, i, k, l show the outer limiting membrane (OLM) location, and medium-sized arrowheads in e–g, i indicate P2RY1 labelling in inner cone and some outer segments and/or the OLM. Images of ouabain-injured mature retina sections 80 hpl and 7 dpl are depicted in i–k and l–n, respectively. Small arrowheads in k show co-localization of both markers likely in the same cell in the INL, GCL, and fibre layer regions. o–v Images of the ciliary marginal zone (CMZ) 7 dpl. The merger of red and green images of the same microscopic field is shown in k, n, q, u. Big arrowheads in s–u indicate sites of BrdU-positive nuclei surrounded by red IR. Scale bars 40 μm (a–h), 28 μm (i–n), 15 μm (o–r), and 10 μm (s–v). PRS photoreceptor segments, ONL outer nuclear layer, OPL outer plexiform layer, INL inner nuclear layer, IPL inner plexiform layer, GCL ganglion cell layer, DCN double-cone nuclei, SCN single-cone nuclei, RPE retinal pigmented epithelium, CHL choroid layer, BV blood vessel

