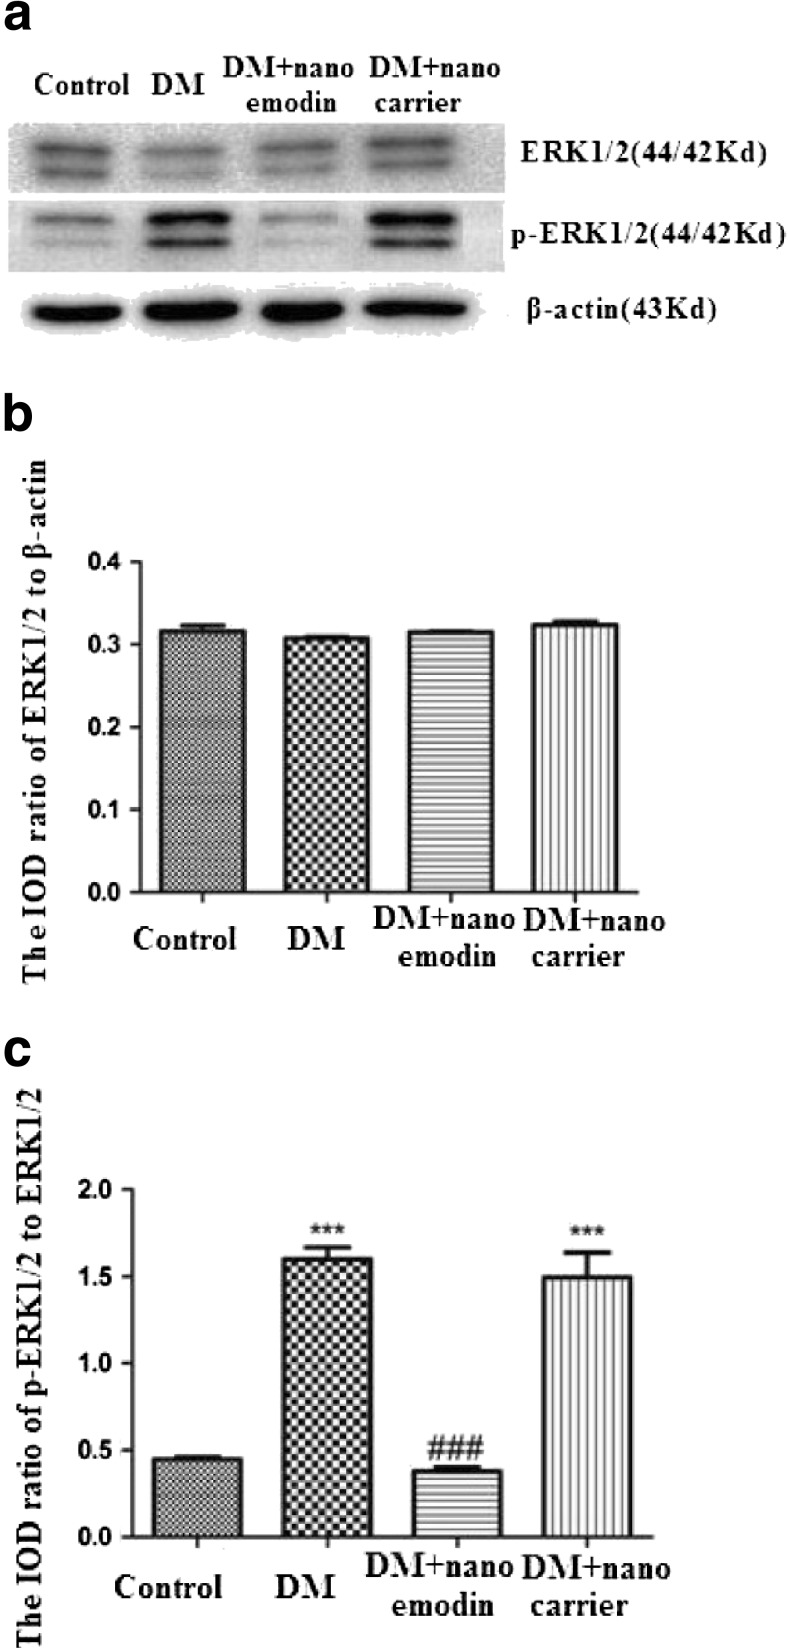
Fig. 4.
Effects of nano emodin on levels of ERK1/2 and p-ERK1/2 in the DRG of T2DM rats. a. Expression levels of ERK1/2 and p-ERK1/2 in the DRG were analyzed using Western blots. b. The integrated optical density (IOD) ratio of ERK1/2 to β-actin was not significantly different between the two groups (p > 0.05). c. The IOD ratio of p-ERK1/2 to ERK1/2 in the DM group was higher than in the control group (n = 8). The IOD ratio of p-ERK1/2 to ERK1/2 in DM rats treated with nano emodin was significantly lower than in the DM group (p < 0.05, n = 8 for each group). There was no difference in the IOD ratio of p-ERK1/2 to ERK1/2 between the DM group and DM + nanocarrier group (p > 0.05, n = 8 for each group). Results are expressed as mean ± SEM, n = 8. *p < 0.05 compared to the control group; # p < 0.05 compared to the DM group

