Fig. 3.

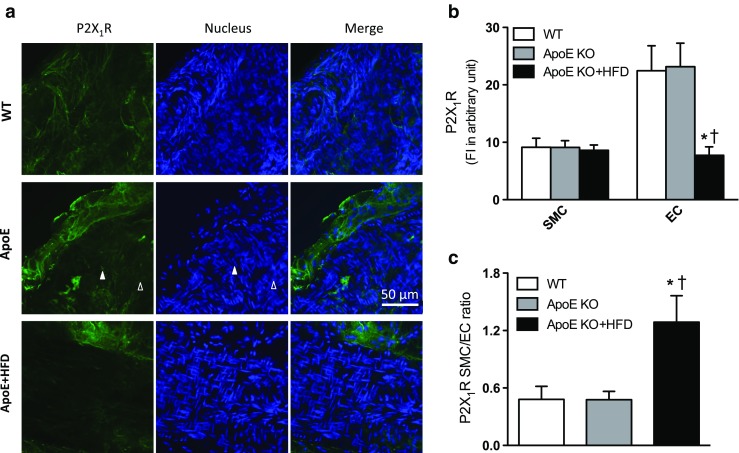
P2X1R expression in isolated mouse coronary arteries in atherosclerosis. a Representative confocal fluorescence images showing P2X1R fluorescence intensity in coronary arteries from WT, ApoE knockout (KO), and ApoE KO + high-fat diet (HFD) mice. Scale bar 50 μm; solid triangle: smooth muscle cells (SMCs) or corresponding nucleus; open triangle: endothelial cells (ECs) or corresponding nucleus. b Quantification of P2X1R expression in ECs vs. SMCs in isolated coronary arteries from WT (n = 5), ApoE KO (n = 9), and ApoE KO + HFD mice (n = 5). c SMC/EC ratio of P2X1R expression in isolated coronary arteries from WT, ApoE KO, and ApoE KO + HFD mice. Values are mean ± SEM. *P < 0.05 vs. corresponding WT; †P < 0.05 vs. corresponding ApoE KO
