FIGURE 5.
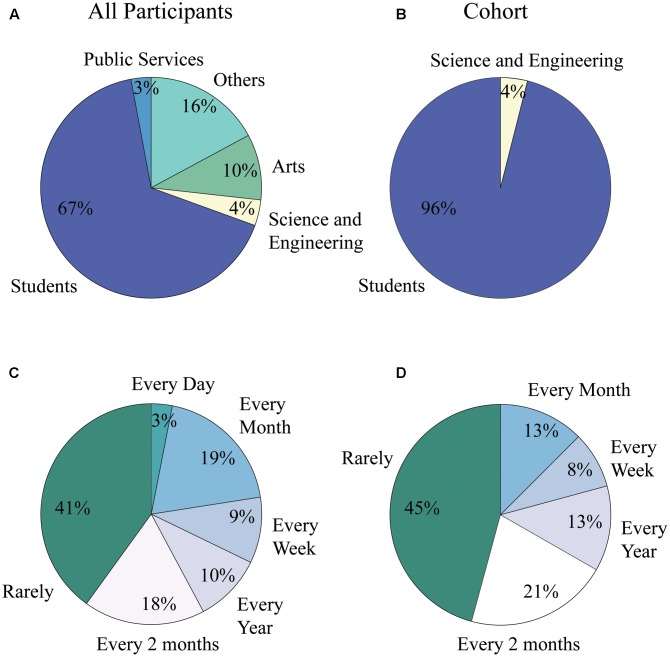
Art consumption levels and occupation distribution of population and cohort. (A) Occupational distribution for all participants of the study. 67% were students while only 10% were people working in the field of the arts. (B) Occupational distribution for analysis cohort. 86% of subjects were students, while none were involved in professional activities within the field of the arts. (C) Art consumption level for all participants of the study. Forty one percent were in contact with the arts less than one time every 2 months, while only 3% of them experienced art on a daily basis. (D) Art consumption level for analysis cohort. Forty five percent were in contact with the arts less than one time every 2 months, while none of the subjects experienced art on a daily basis.

