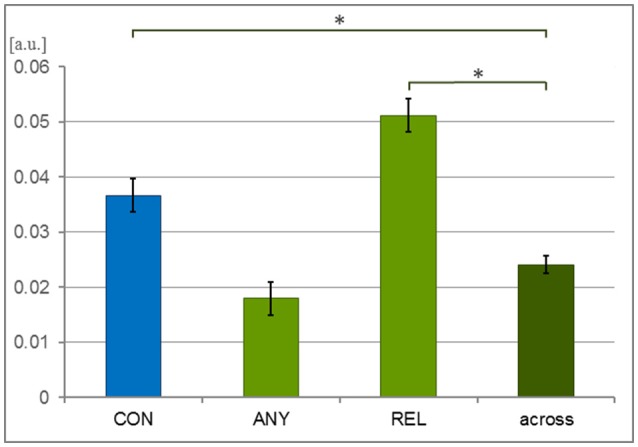
Figure 2.

Covariance of behavioral responses. Thirty-six participants watched 6 video clips of 2 narrations each during a behavioral experiment. The time series of button press responses were analyzed with covariance analysis. To compensate for the event frequency, the response profiles were resampled to the same number of button presses in each condition. These response profiles were expected to be more similar—and thus their covariance higher—for the same task than across different tasks. Indeed, the CON task (conventionality) and the REL task (relation to speech) yielded higher covariance than the across-task comparison but not the ANY task (any hand movement). Bars represent mean ± SEM; *p < 0.001; [a.u.], arbitrary unit.
