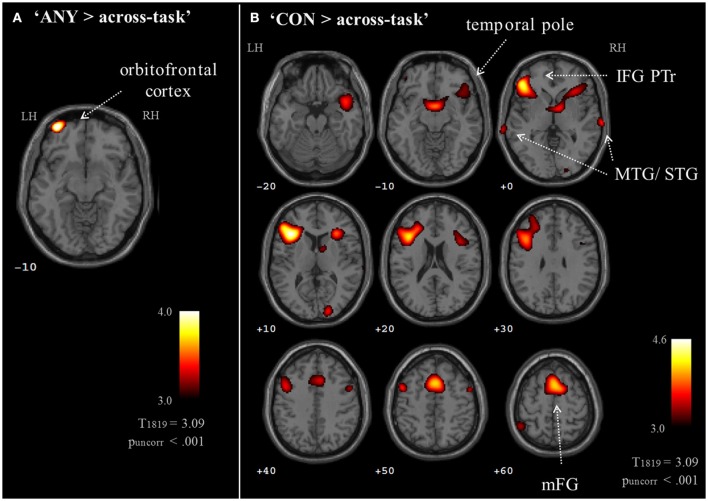
Figure 5.
Exploratory whole brain maps for task effects. Exploratory t-maps (puncorr < 0.001; cluster threshold: 10 voxels) compared each task map to the across-task condition. (A) The contrast “ANY > across-task” revealed increased ISC at the left orbitofrontal cortex. (B) The contrast “CON > across-task” confirmed the left IFG response and further revealed contributions of the medial frontal gyrus, bilateral temporal cortices, right IFG, precentral gyrus, and cuneus. The contrast “REL > across-task” did not yield results on a whole-brain map. MTG, middle temporal gyrus; STG, superior temporal gyrus; IFG PTr, inferior frontal gyrus, pars triangularis.

