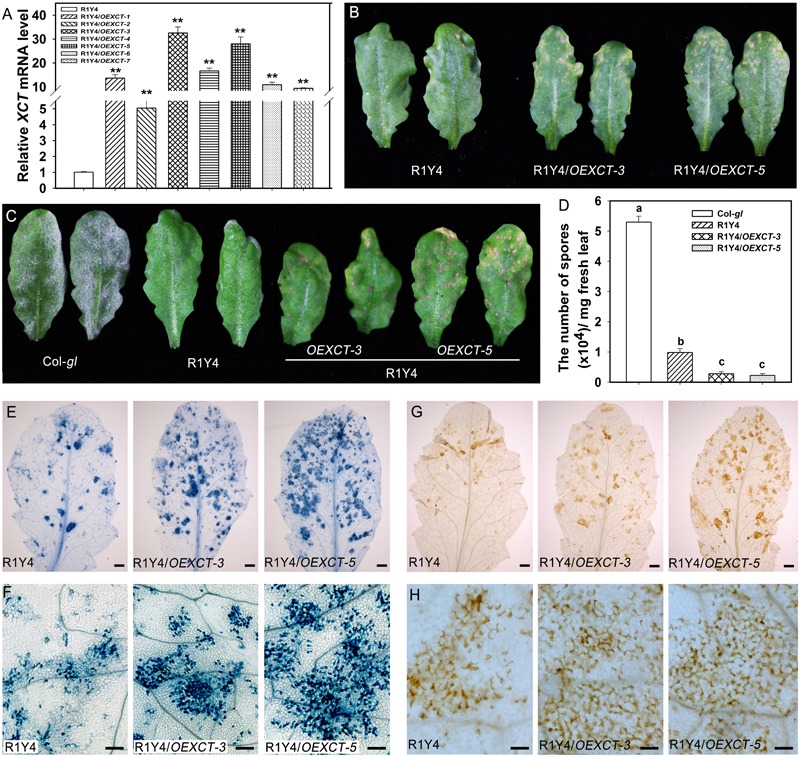
FIGURE 6.

Overexpressing XCT enhances RPW8.1–mediated cell death and disease resistance. (A) Relative mRNA levels of XCT detected by quantitative RT-PCR (qRT-PCR) in the indicated transgene lines. Error bars indicate SD (n = 3). Asterisks ∗∗ above the bars indicate significant differences (P < 0.01) as determined by Student’s t-test between R1Y4 and the indicated transgenic lines (R1Y4/XCTOE-1∼R1Y4/XCTOE-7). (B) Representative leaves from the indicated lines of 5-week-old plants show the difference of cell death lesions. (C) Representative leaves show the disease phenotype of powdery mildew. Photos were taken at 10 dpi. (D) Quantitative analysis of sporulation at 10 dpi of the indicated lines. Error bars represent SD (n = 8). Letters above the bars indicate statistically significant differences at P < 0.01. (E–H) Representative leaves (E,G) and leaf sections (F,H) stained by trypan blue (E,F) and DAB (G,H) from R1Y4 and XCT-overexpressing lines at 10 dpi show clusters of cell death and H2O2 accumulation, respectively. Scale bars: (E,G) 2 mm; (F,H) 50 μm.
