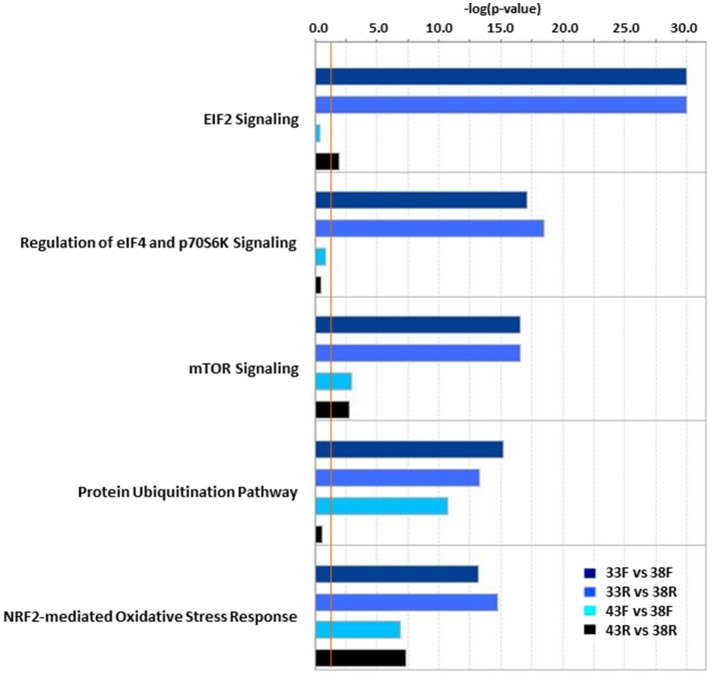
Figure 3.
Significant pathway associations identified in IPA Comparison Analysis of thermal challenge vs. control temperature cells. In each pair-wise comparison, P-values are assigned to canonical pathways based on differential expression (DE). Bar plot provides the 5 most variable pathways with significance. Pathway associations must have a −log(p-value) > 1.3 (threshold, vertical orange line).

