Figure 3.
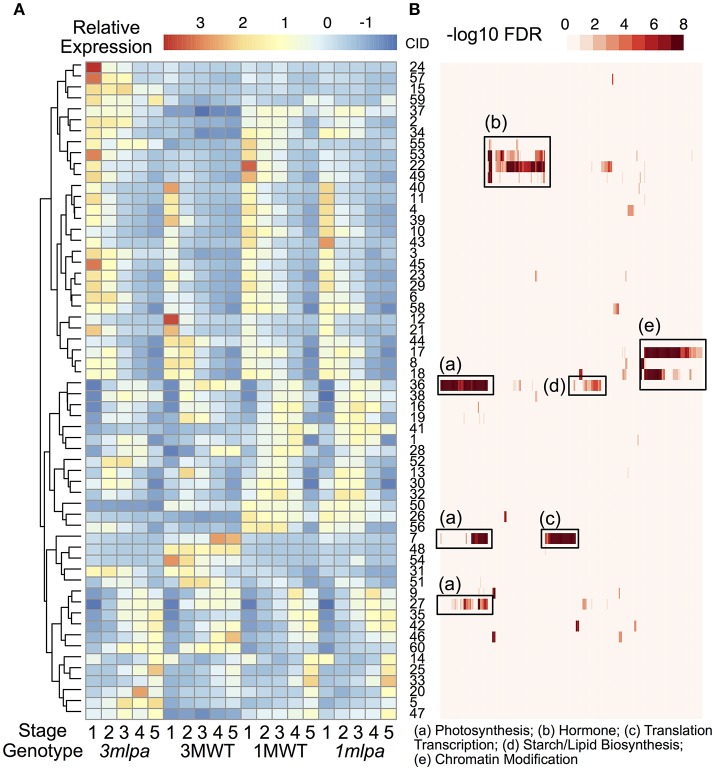
Clustering and gene function analysis. (A) Gene expression clusters. Color indicates normalized expression levels. Genes were clustered based on the K-means clustering algorithm. Hierarchical clustering was performed on the rows of the average expression levels for each cluster. Numbers on the right of the heatmap represent cluster id (CID, 1 to 60). (B) GO functional enrichment analysis. Rows of this heatmap is organized as the same order as the expression clusters. Each column represents a GO category. Color represents -log10 FDR from enrichment analysis. Some enriched categories were summarized and annotated under the heat map. The complete set of enriched GO categories is provided as supplementary information.

