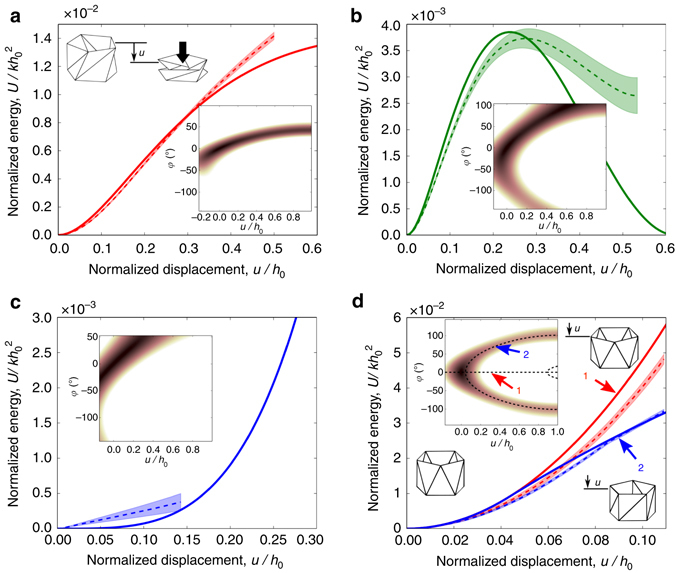
Fig. 2.

Folding behaviors of the TCO cells. a–d The energy analysis for the TCO-based truss structures shows remarkably different behaviors: a Monostability at (h 0, θ 0) = (90 mm, 46°); b bistability at (150 mm, 40°); c zero-stiffness mode at (140 mm, 92°); and d bifurcation at (119 mm, 0°). The displacement is normalized by h 0, and energy is normalized by . Experimental results (mean value is shown as dashed curves, and s.d. is represented by colored areas) show qualitative agreements with the analytical predictions (solid curves). The inset plots show the equi-potential plots of as a function of u/h 0 and φ, in which highlighted trajectories indicate the valley of minimum potential energy. In the experimental curves, the range of u/h 0 is restricted by the folding motions of the TCO-based truss prototypes (Supplemental Movie 3). For example, the highly twisted shape of the zero-stiffness TCO prototype (Fig. 1g) causes the truss elements overlap in the early stage of folding, allowing only ~15% of u/h 0 as shown in the panel c. The moderately twisted geometry of the monostable and bistable cases (Fig. 1e, f) permit more compression, allowing ~ 50% folding of the truss structure in terms of u/h 0 as shown in a, b
