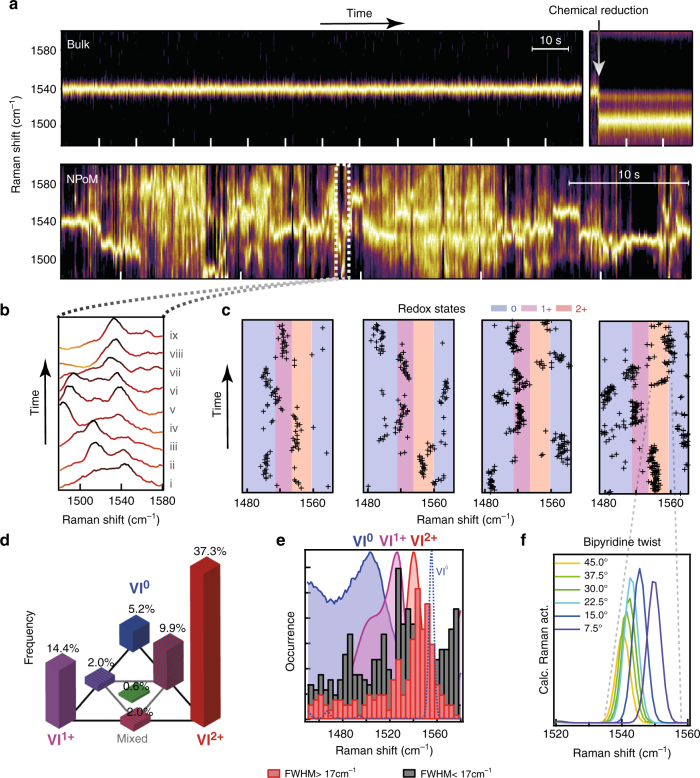
Fig. 4.
Single-molecule Redox analysis in individual NPoM geometries. a Normalised SERS time scans of VI with CB[8], ticks represent 10 s: (top) bulk measurement in solution with NaBH4 added after 115 s (arrow); (bottom) NPoM measurement taken over 70 s. b Short (0.9 s) segment from NPoM time scan showing the reduction and oxidation processes of VI. c Evolving vibrational peak positions from several NPoM constructs compared to redox states of Fig. 3b. d Tri-analyte analysis showing the rarity of seeing more than one redox state, by correlating occurrences of one or several sets of identified SERS peaks (remaining 29.% have no peaks detected, not shown). e Distribution of peak positions sorted into histograms of wide FWHM > 17 cm−1 (red) and narrow peaks FWHM < 17 cm−1 (grey). f, Spectral change in calculated 1542 cm−1 peak as a result of twisting between pyridine groups

