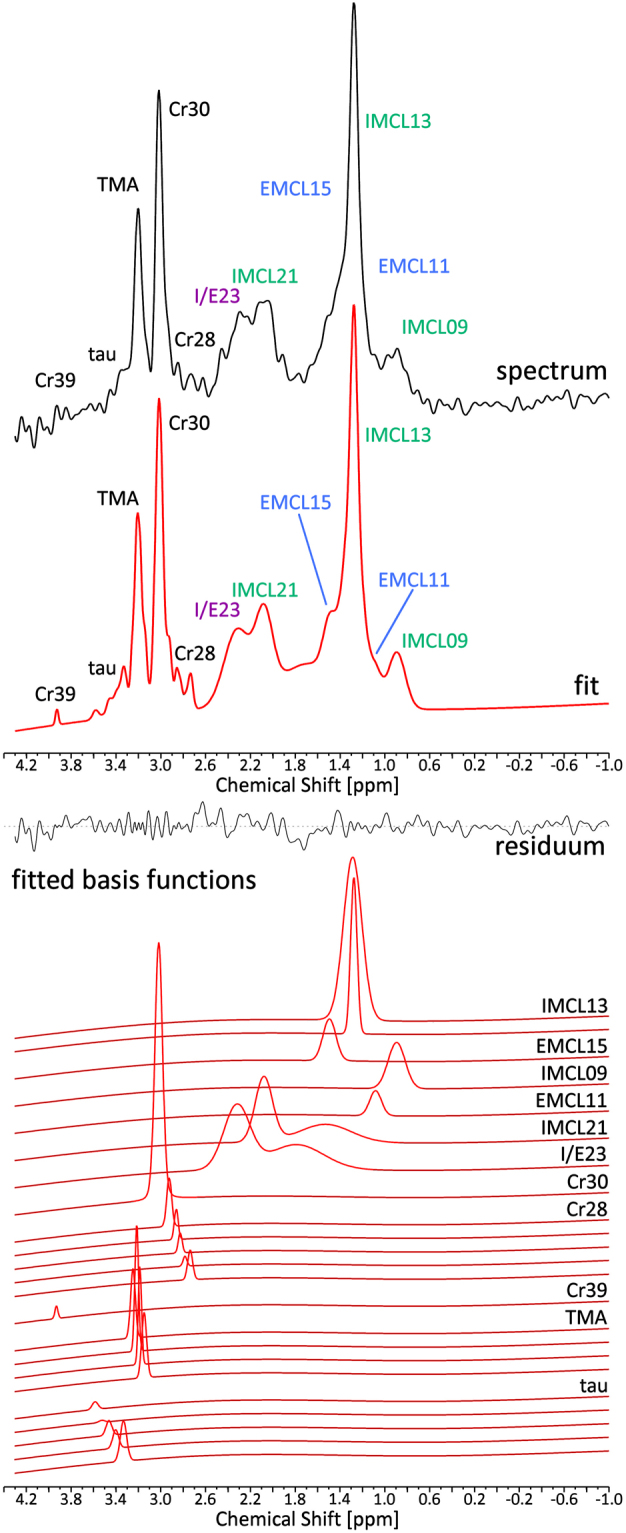
Figure 4.

Measured 1H MR spectrum from the myocardium of a volunteer. The measured spectrum is shown (black, top panel) along with the fit (red, top panel). Different lipid components are indicated in green (intramyocellular lipids, IMCL) and blue (extramyocellular lipids, EMCL). The resonance from the IMCL resonance at 2.3 ppm and from the EMCL resonance corresponding to IMCL21, but shifted due to susceptibility effects to 2.3 ppm are approximated with only one basis set by LCModel. The mixed signal I/E23 of these two moieties is marked in purple. The middle panel displays the residuum of the LCModel fit. The different fitted basis functions from LCModel are shown in the bottom panel with the assigned metabolites on the right. Several metabolites are fitted as the sum of different slightly shifted peaks by LCModel to take effects on line shape, such as dipolar coupling, into account. In this case 1024 averages were acquired. Since respiratory motion effects did not have a negative effect on the spectrum’s SNR and line shape, no averages were discarded.
