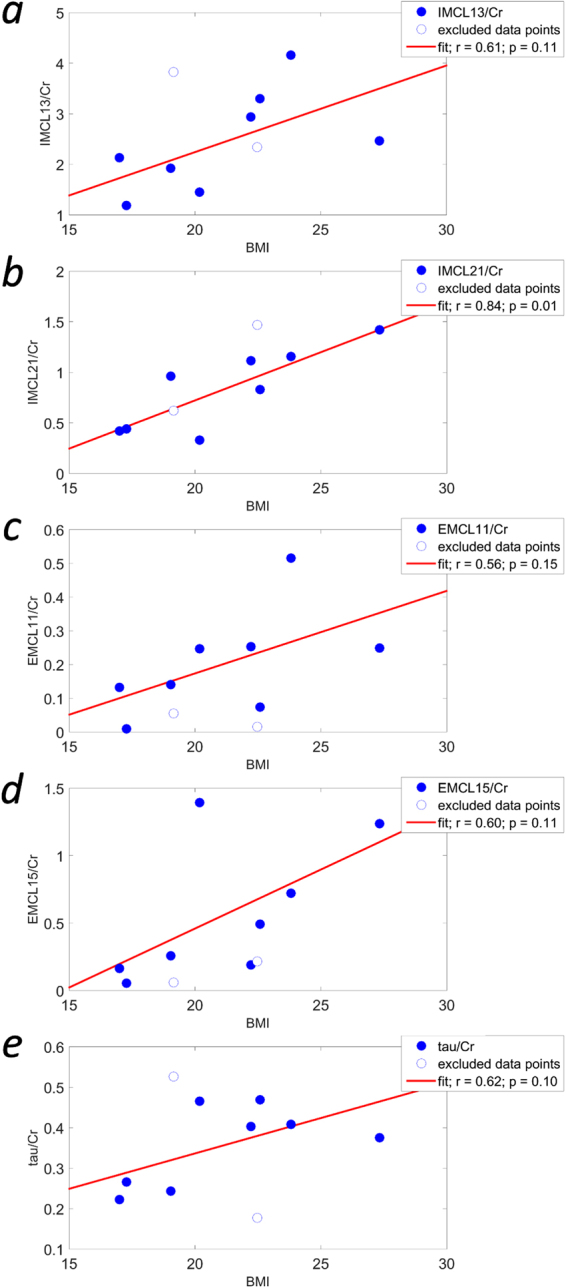
Figure 6.

Correlations of metabolite/Cr ratios with BMI. IMCL13/Cr (a), IMCL21/Cr (b), EMCL11/Cr (c), EMCL15/Cr (d), and tau/Cr (e) plotted versus the body mass index (BMI) of the healthy volunteers. Data points that were excluded from analysis are shown as open circles. Linear regressions are displayed as red lines, and Pearson regression coefficients, r, and significance values, p, are given for each data set. It can be seen (b) that the IMCL21/Cr ratio correlates significantly with BMI. Although not statistically significant, the other metabolite/Cr ratios shown here do exhibit a strong positive correlation with BMI, suggesting that not only unsaturated bonds in IMCL fatty acids (IMCL21) are increased at high BMIs, but also the number of lipid molecules in EMCL, the number of saturated bonds in fatty acids of both compartments, as well as taurine. Other metabolite/Cr ratios that do not show a strong correlation with BMI can be found in the supporting information (Fig. S5.1).
