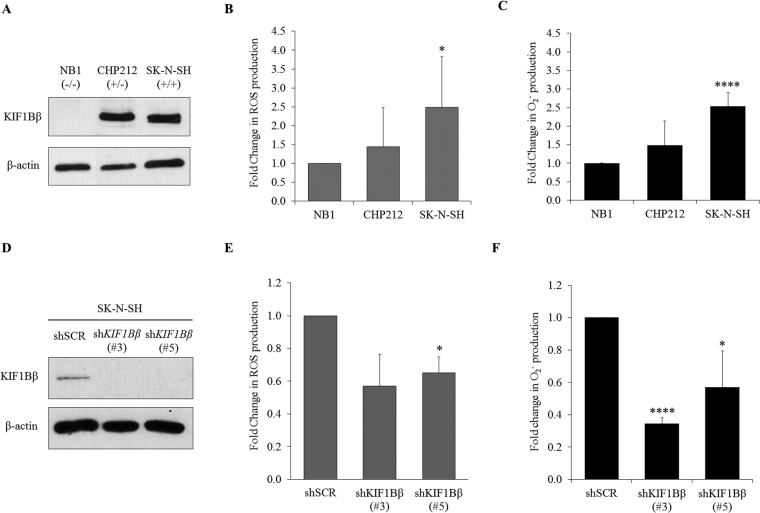
Figure 1.
Endogenous total ROS and O2 − levels correspond to KIF1Bβ expression in neuroblastoma cells. (A) Immunoblot analysis of KIF1Bβ in neuroblastoma cell lines NB1, CHP212 and SK-N-SH. (B) Flow cytometric analysis of intracellular ROS with DCFDA (mean ± SD; n = 3; *P < 0.05). (C) Intracellular O2 − measured with lucigenin-based chemiluminescence assay (mean ± SD; n = 3; ****P < 0.0001). (D) Immunoblot analysis of SK-N-SH cells stably transduced with lentivirus encoding shRNAs targeting KIF1Bβ (shKIF1Bβ #3 and #5) or control virus (shSCR) and selected with 1 µg/ml puromycin for 8 days. (E) Corresponding fold change in flow cytometric analysis of intracellular ROS and (F) Fold change in intracellular O2 − determined using lucigenin-based chemiluminescence assay of SK-N-SH cells stably transduced with lentiviruses as indicated (mean ± SD; n = 3; *P < 0.05; ****P < 0.0001).

