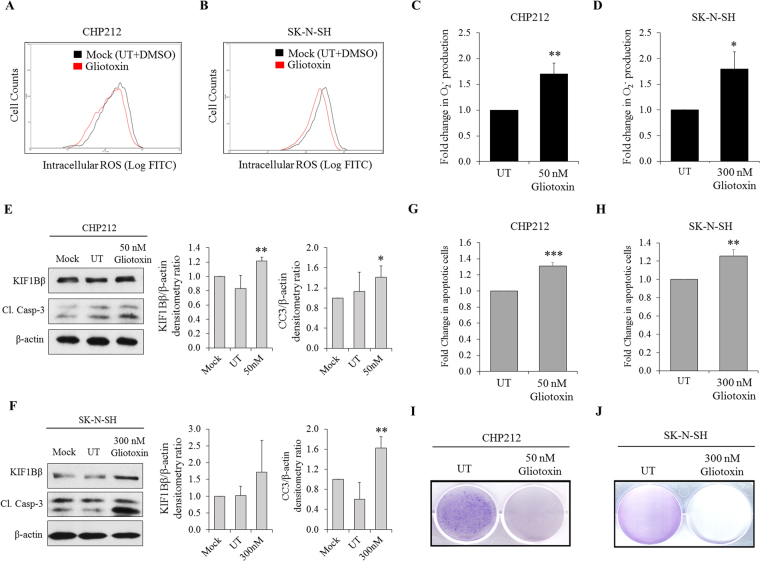
Figure 5.
Gliotoxin induces O2 − to increase KIF1Bβ protein expression and apoptosis in neuroblastoma cells. (A) Flow cytometric analysis of intracellular ROS in CHP212 and (B) SK-N-SH cells after 1 hour of Gliotoxin treatment at 50 nM and 300 nM respectively. (C) Fold change in intracellular O2 − determined using lucigenin-based chemiluminescence assay in CHP212 and (D) SK-N-SH cells after 24 hours (50 nM) and 12 hours (300 nM) of Gliotoxin treatment respectively (mean ± SD; n = 3; *P < 0.05; **P < 0.01). (E) Immunoblot analysis of CHP212 and (F) SK-N-SH cells after 24 hours (50 nM) and 12 hours (300 nM) of Gliotoxin treatment respectively. Right – corresponding densitometry for KIF1Bβ and cleaved caspase-3 (CC3) expression (mean ± SD; n = 3; *P < 0.05; **P < 0.01). (G) Corresponding flow cytometric analysis of Propidium iodide/Annexin V (PI/AV) apoptotic cell staining in CHP212 and (H) SK-N-SH cells after 24 hours (50 nM) and 12 hours (300 nM) of Gliotoxin treatment respectively (mean ± SD; n = 3; **P < 0.01; ***P < 0.001). (I) Crystal violet staining to determine colony formation ability of CHP212 and (J) SK-N-SH cells that were treated with Gliotoxin for every 24 hours (50 nM) and 12 hours (300 nM) respectively, for several days.

