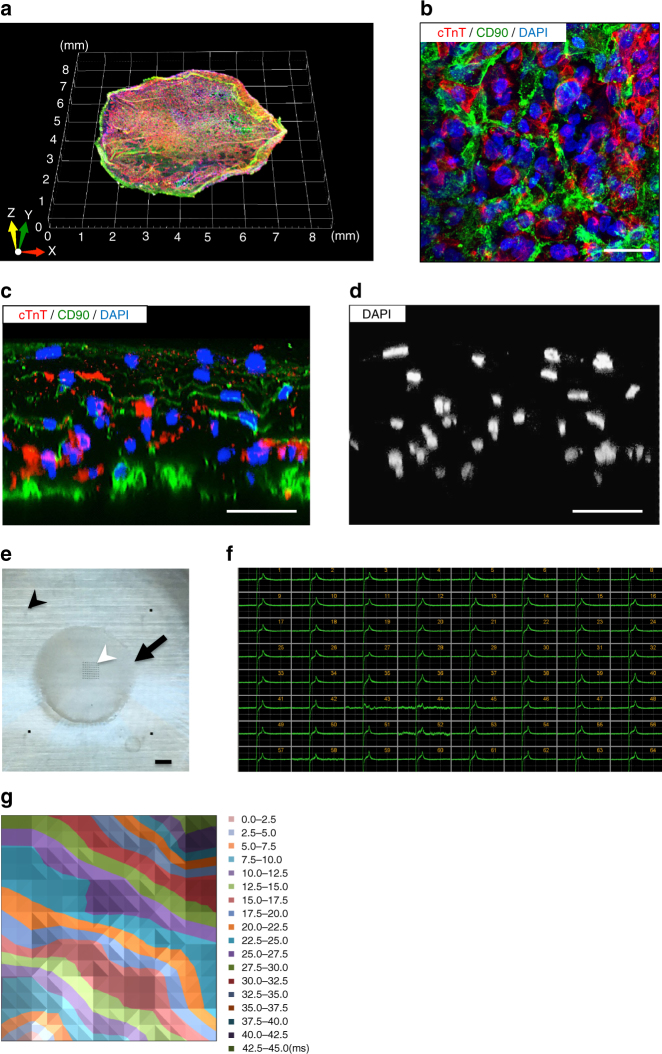
Fig. 1.
Characterization of heterogeneous 3D cardiac tissue sheets (CTSs). a Representative confocal microscopic image of a whole CTS that was immunostained for cTnT (cardiomyocytes, red), CD90 (mesenchymal cells, green), and DAPI (nuclei, blue). b High-magnification image of a horizontal cross-section (see Supplementary Movie 1). cTnT (red), CD90 (green), and DAPI (blue). c Confocal immunostaining of a vertical cross-section. cTnT (red), CD90 (green), and DAPI (blue). d Confocal immunostaining of a vertical cross-section. DAPI (white). e Macroscopic appearance of a CTS set on a multi-electrode array probe. Arrow: CTS. Black arrowhead: a reference electrode (four reference electrodes in total). White arrowhead: main electrodes (multi-electrode array). f Representative EFP waveforms obtained from each electrode. g Representative electrical propagation map. Propagation from the lower left corner towards the upper right direction. cTnT, cardiac troponin-T; DAPI, 4′,6-diamidino-2-phenylindole. Scale bars: 25 μm in b, 50 μm in c, d, and 1 mm in e

