Fig. 3.
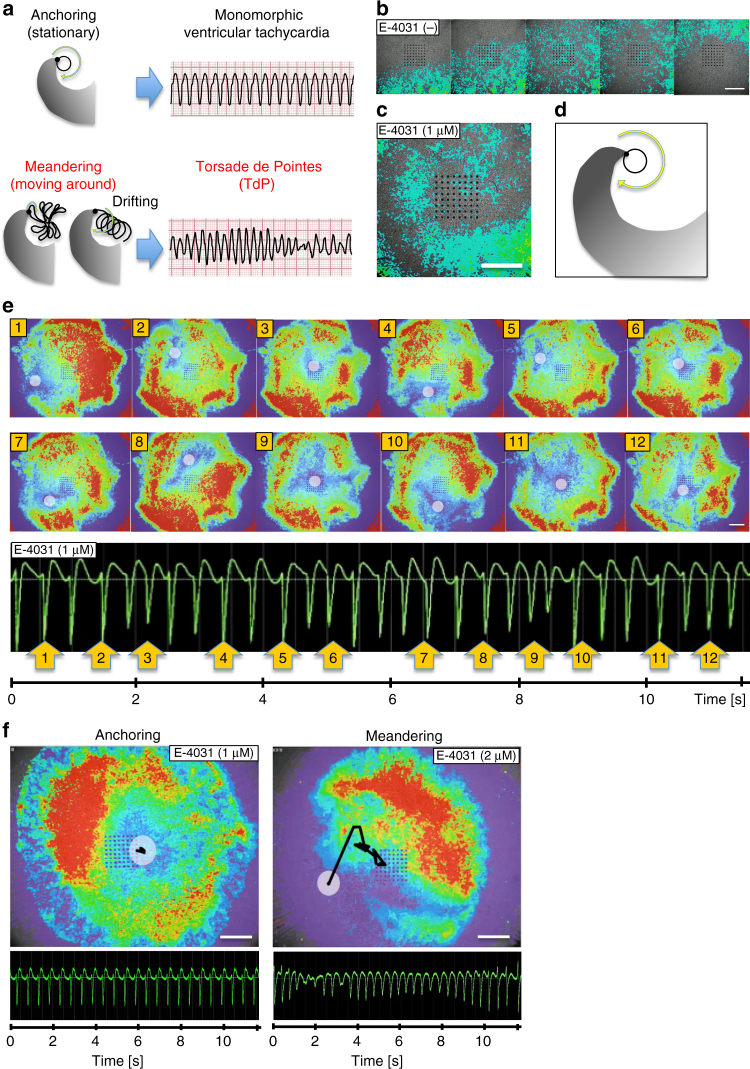
Drug-induced TdP in CTSs visualized by Motion Vector Prediction. a Schematic images of two re-entrant arrhythmia patterns for the spiral wave re-entry theory. Anchoring pattern and Meandering pattern. b Representative normal beats visualized by motion vector prediction (captured from Supplementary Movie 3). Unidirectional biphasic wave propagation (E-4031, 0 nM). c Representative anchoring spiral wave re-entry visualized by motion vector prediction (captured from Supplementary Movie 4). Anchoring spiral wave re-entry motion propagation (E-4031, 1 μM). d Schematic image related to c. e Representative meandering spiral wave re-entry with simultaneous recording of EFP and cell motion (E-4031, 1 μM). Cell motion is visualized by motion vector prediction (captured from Supplementary Movie 6). White circles: spiral wave center. EFP shows TdP-like waveform. The numbers in the upper and lower panels indicate the same time points. Note that similar spiral wave center movement (ex: 2 to 3 and 5 to 6) causes similar EFP polymorphisms. f Tracing of the spiral wave centers. Representative anchoring of spiral wave re-entry with the corresponding monomorphic ventricular tachycardia-like EFP waveform (E-4031, 1 μM) and representative meandering (drifting) of spiral wave re-entry (upper) with the corresponding TdP-like EFP waveform (E-4031, 2 μM). White circles: center of spiral wave. Black lines: trace of the center. Scale bars: 1 mm

