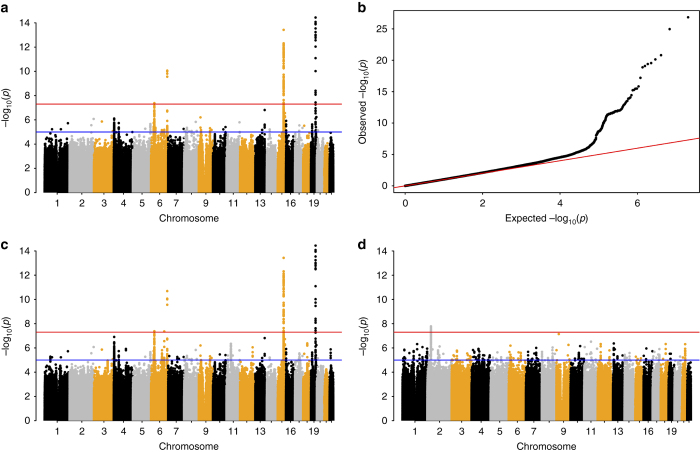
Fig. 1.
Genome-wide associations with parental lifespan. Association analysis was carried out using imputed allelic dosages. a Manhattan plot for LifeGen European ancestry, with both parents combined; b Q−Q plot comparing the expected (under the null hypothesis) and actual (observed) –log10 p-values for results in a; c Manhattan plot of meta-analysis of LifeGen Europeans (both parents combined) with CHARGE-EU 90+ published summary statistics6. The meta-analysis used Z-scores and equal weights, as suggested by the near equality (9.5/9.4, LifeGen, CHARGE) of Z-test statistics at rs4420638. The additional (just) GW significant SNP lies between the two chromosome 6 hits in a; d Manhattan plot for LifeGen African fathers only. In Manhattan plots, the y-axis has been restricted to 15 to aid legibility

