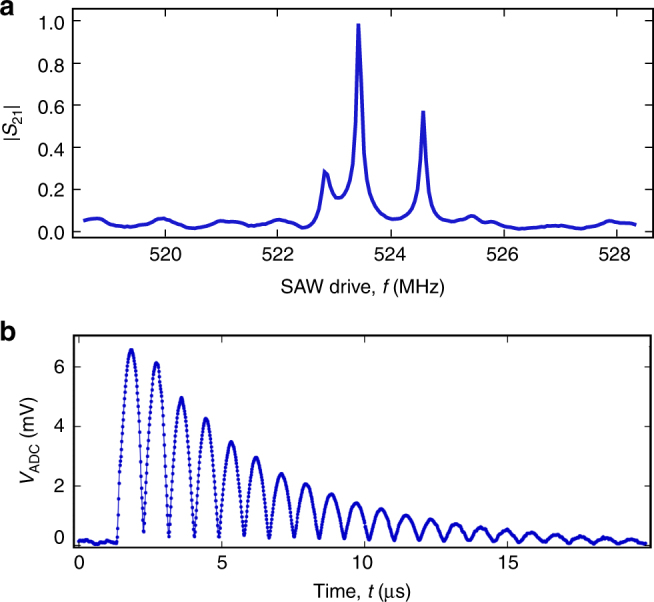
Fig. 2.

SAW cavity response. a Normalised linear magnitude of the measured transmission coefficient S 21 of the 2-port SAWR (blue solid line). The transmitted signal has been acquired with a vector network analyser with input power set at −30 dBm. b Time resolved measurement of the 2-port SAWR. This measurement has been performed by applying a 800 ns ≲ 2L c/v e electrical pulse to IDT1 and acquiring the output signal from IDT2. The graph shows the voltage difference at the input of the acquisition card
