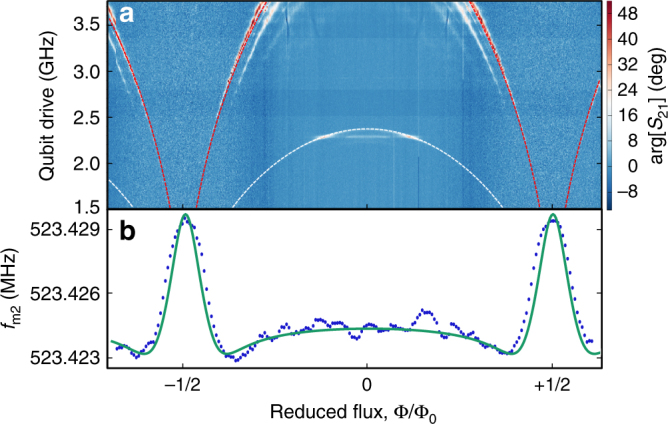
Fig. 3.

Flux dependent acoustic shift. a Qubit spectroscopy performed with the CPWR as a function of reduced magnetic flux. The red dashed line is a fit to Eq. (2) and indicates the qubit transition frequency f q(Φ). The white dashed line, with analytical form f q(Φ)/2, denotes an excitation of the qubit via a two photon process. b Measured resonant frequency of the acoustic mode f m2 as a function of reduced flux at fixed SAW drive power of −80 dBm (blue points) and numerical model based on Eq. (1) (green solid curve)
