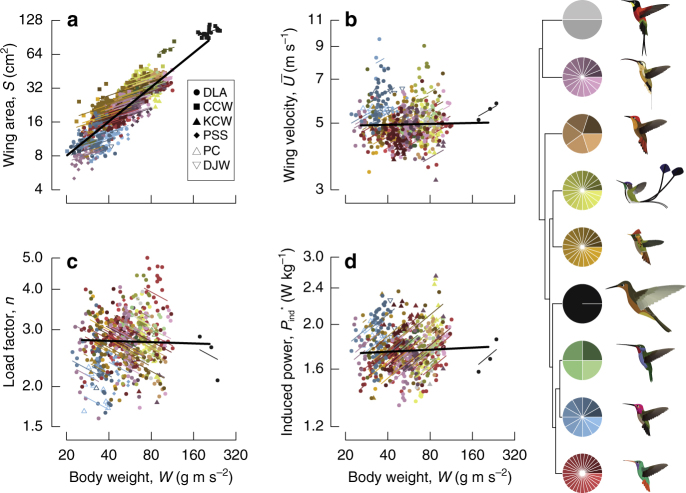
Fig. 3.
Allometric divergence among and within species. We contrast the slopes of wing area (a), wing velocity (b), load factor (c) and induced power requirements (d). The slope of each variable on body weight among species is shown in black, and each was calculated allowing for phylogenetic non-independence and measurement error. Individual records are shown along with the mean within-species slope fit through the respective empirical species means. Symbols denote collector. Individual observations and within-species slopes are coloured and shaded by species within clade, according to the cartoon phylogeny at right (colours as in Fig. 1). Sample sizes are provided in Supplementary Table 1

