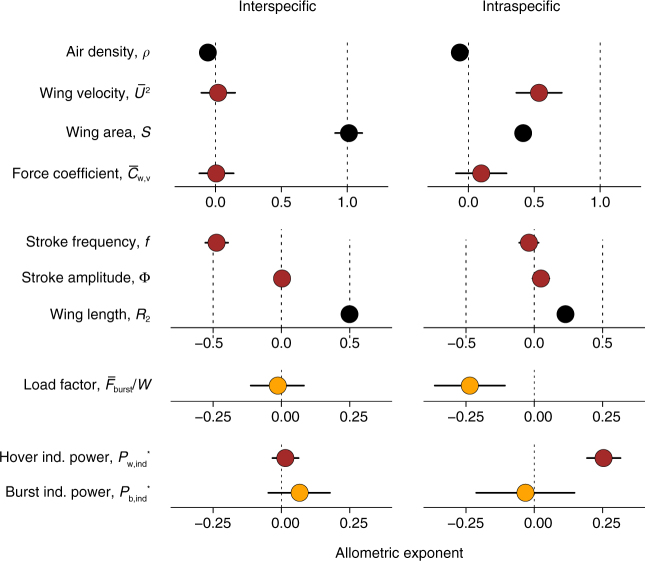
Fig. 4.
Comparison of allometric variation among and within species. Constant allometry of wing velocity among species coincides with constant burst force generation (load factor) and induced power. Positive allometry of wing velocity within species coincides with reduced load factor and escalating power requirements. The mean and 95% equal-tailed credible intervals of the posterior distribution of the allometric exponents are shown for each variable. Black circles are static morphological and environmental measurements, red circles were measured during hovering, and gold circles were measured during burst performance. Sample sizes are provided in Supplementary Table 1

