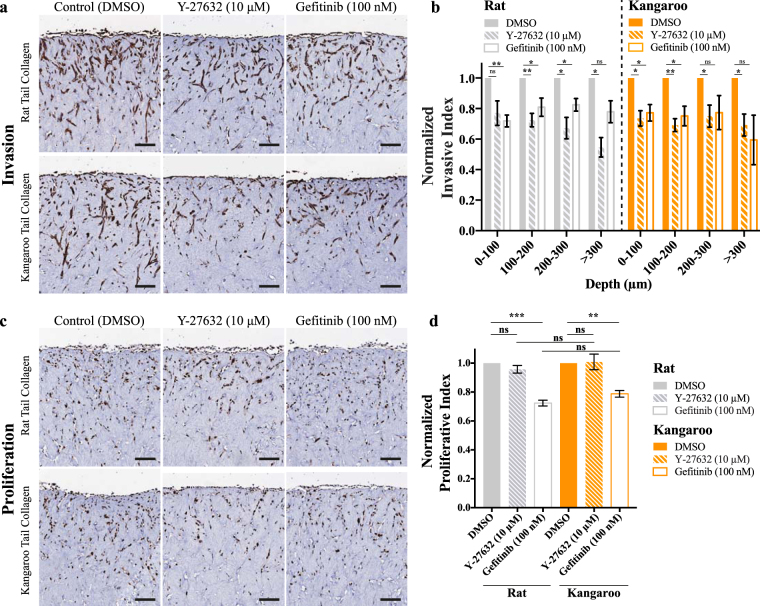
Figure 6.
An example of a small-scale pre-clinical drug screen with the TNBC breast cancer cell line MDA-MB-231, invading into organotypic matrices and treated for 7 days with either control (DMSO), Y-27632 (10 μM) or Gefitinib (100 nM). Representative images are given for (a) pan-cytokeratin staining, which was (b) scored for invasion depth (n = 4). Representative images are also given for (c) Ki67 staining, which was (d) scored for proliferation (n = 4). Scale bars: 100 μm. Scale bars (insets): 12.5 μm. Mean ± SEM.

