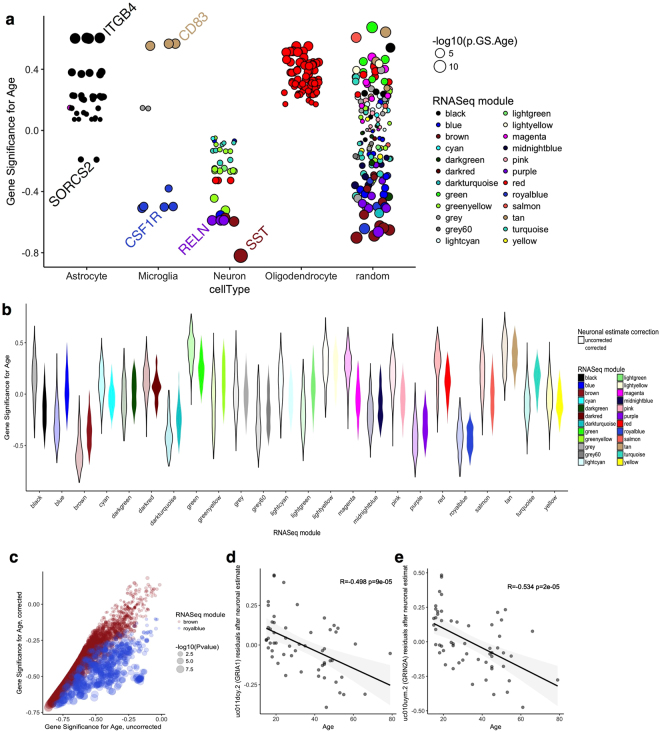
Figure 5.
Population-specific expression analysis disambiguates age-related changes in cellularity from cell-dependent gene expression. (a) Correlation (GS) between age and transcript expression for genes representative of the major classes of cells in the CNS (horizontal axis) or a similar number of randomly selected genes. Genes are sized by the −log10 of the p value for association with age and colored by the WGCNA module assignments in our RNA-Seq dataset; note that all available transcripts were used for each gene. (b) Violin plot of the distribution of values of R with age (vertical axis) for all transcripts in a given WGCNA module (horizontal axis) either without (lighter colors outlined in black) or after correction for the proportion of neuronal cells in each sample (darker colors). (c) Comparison of uncorrected (horizontal axis) and neuron-corrected (vertical axis) associations with age for all transcripts in the brown, synaptic, module, that showed an overall negative correlation with age. Points are sized to the p value for association with age in the corrected samples. (d,e) Associations with age remain for specific transcripts after correction for neuronal proportions. The residuals after linear regression for neuronal markers are plotted on the vertical axis for each sample of different ages on the horizontal axis for transcript uc011dcy.2 (GRIA1, d) and uc010uym.2 (GRIN2A, e).

