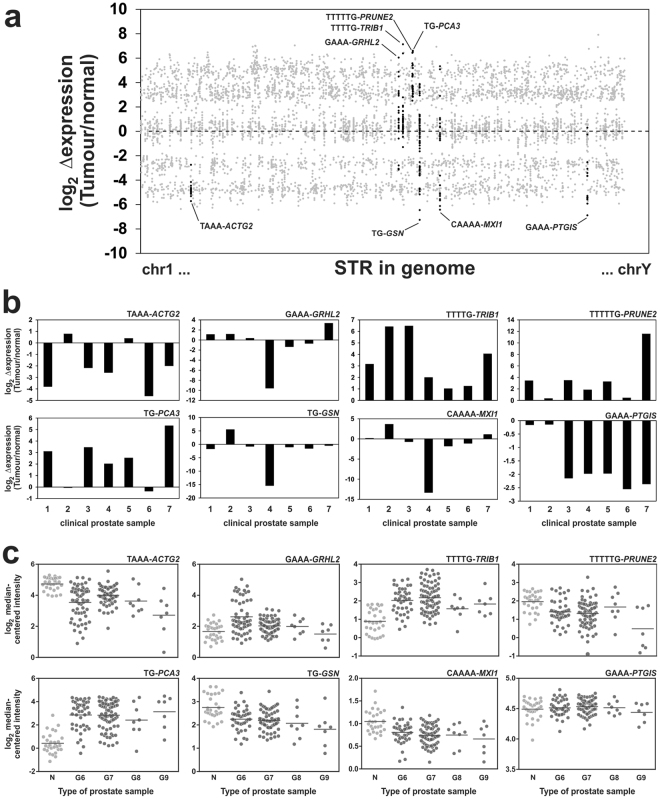
Figure 3.
Scatterplot of differential STR expression between tumors and adjacent non-cancer prostate cells. (a) Highlighted in black dots are 8 candidate STRs that are consistently differentially expressed in RNAseq datasets, and/or are expressed in a large number of RNAseq datasets from ours (n = 8) and Ren et al. (n = 14) clinical prostate samples40. (b) RT-qPCR analysis of the 8 candidate STRs in another cohort (n = 7) of clinical prostate samples. (c) Analysis of microarray expression data from the Taylor et al. study in non-cancer cells (N), and prostate cancers of Gleason score 6–9 (G6, G7, G8, and G9). The horizontal line represents the mean expression for each group.

