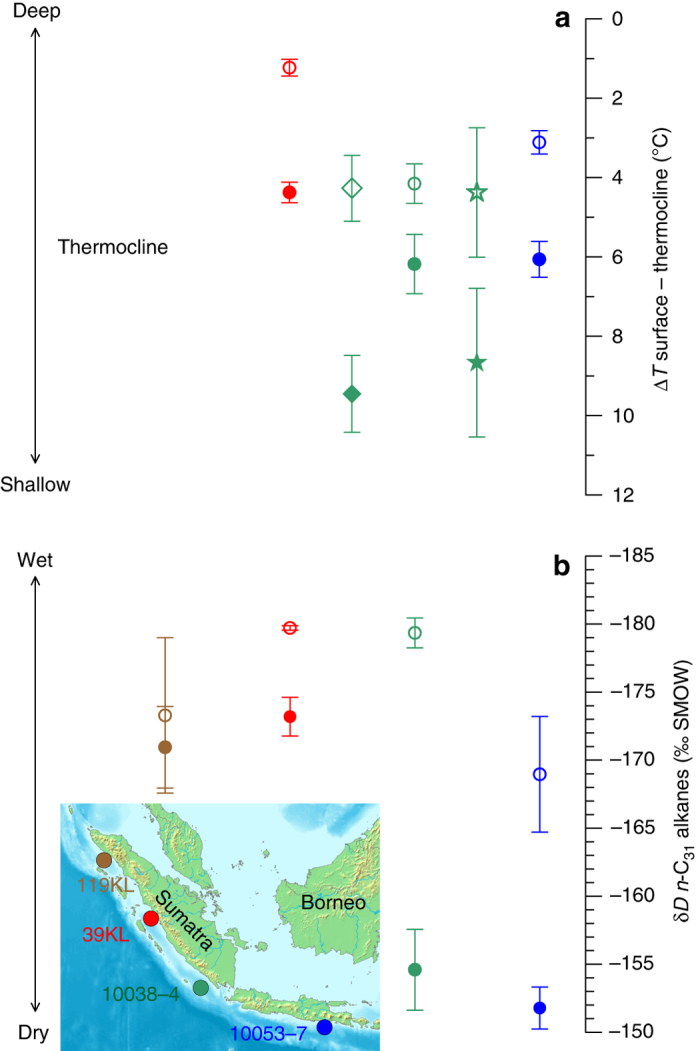
Fig. 1.

Depth of the thermocline and amount of rainfall in the eastern tropical Indian Ocean during the LGM and the late Holocene. a Average values of the difference between sea surface and thermocline temperatures (∆T) as a measure of thermocline depth (reverse scale) at three sites. Coloured symbols represent the average values for the late Holocene (filled) and the LGM (open), and correspond to the sites indicated in the inset map. Circles represent the difference between G. ruber and P. obliquiloculata, stars and diamonds between G. ruber and N. dutertrei and G. tumida, respectively. Vertical bars indicate 95% confidence intervals based on t-distributed samples in each time interval (Methods and Supplementary Data 1). The chronology of each period is established independently by 14C accelerator mass spectrometry dating, each average value comprises a minimum of six samples (Methods, Supplementary Data 1). b As in a but for the average δD values from plant waxes (n-C31-alkanes) by including an additional record (SO189-119KL). LGM values are corrected for relative changes in ice volume (Methods)
