Fig. 6.
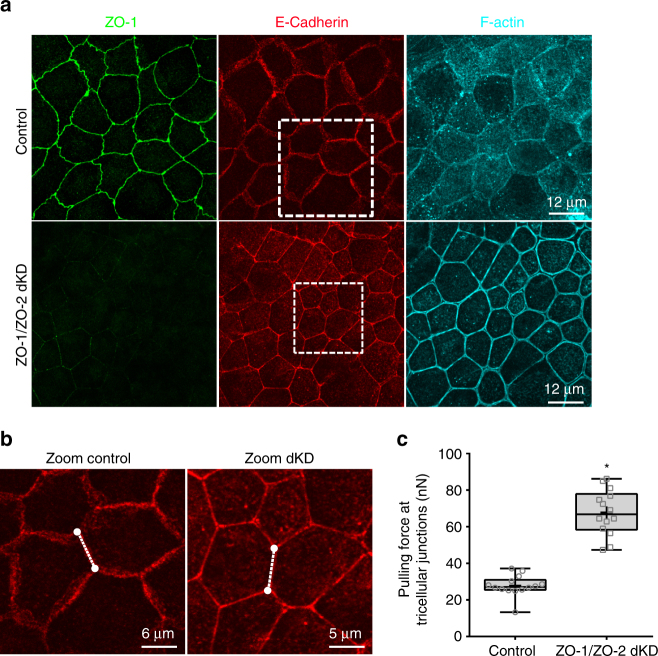
Pulling forces at tricellular junctions increases with depletion of ZO-1 and ZO-2. a Representative confocal images of polarized monolayers of MDCK II Tet-Off controls and ZO-1/ZO-2 dKD cells were grown on glass dishes, fixed, and stained with Alexa Fluor 647-phalloidin (F-actin) and antibodies against tight junction protein ZO-1, the adheren junction protein E-cadherin. The cell shapes of dKD cells are different (more polygonal) than controls, and the adherens cell–cell contacts are straighter. Boxed areas are shown zoomed in (b). (b) Zoomed areas of E-cadherin images depict pair of cells with hexagonal shapes within the polarized epithelium. Dashed lines represent the cell–cell junctions utilized for length estimation. All confocal images are 1.05 µm thick maximum intensity Z-projections. c The plot show that for ZO-1/ZO-2 dKD monolayers the pulling forces acting at tricellular junctions significantly increases compared to controls (F control = 27.8 ± 5.7 nN vs. F dKD = 67.8 ± 12.4 nN). In c, data are represented as mean ± s.d.; * indicates significant difference in comparison with control P < 0.05 (unpaired two-tailed Student’s t-test with Welch’s correction); number of measurements pooled for each condition n = 14

