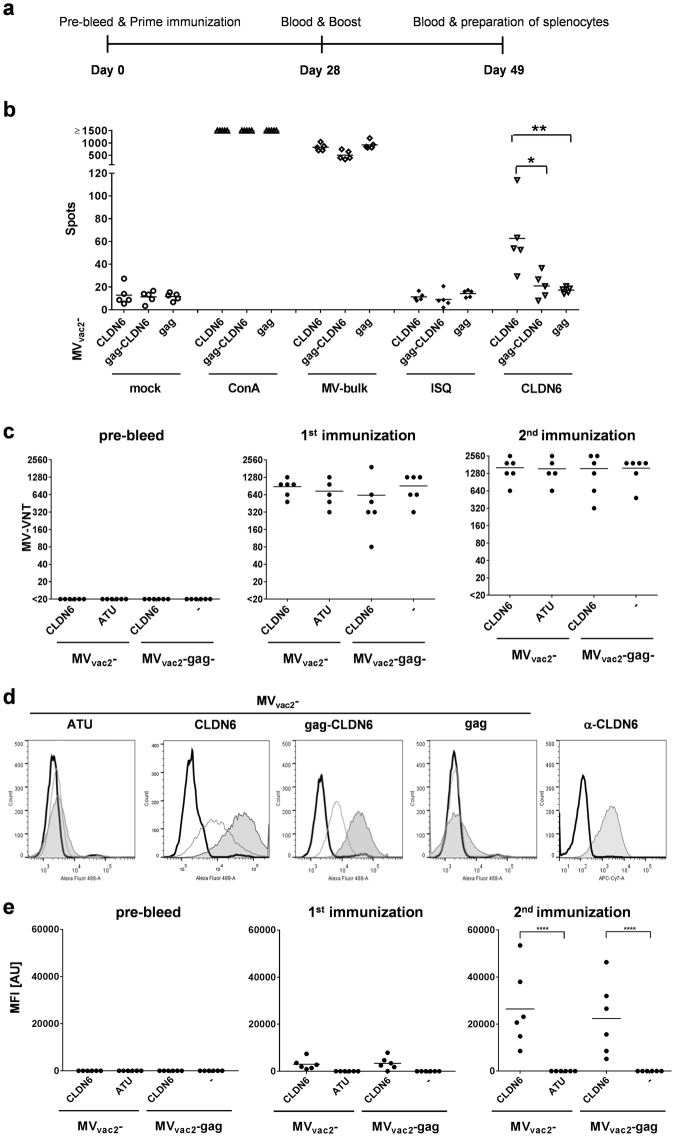
Figure 5.
Antigen-specific cellular and humoral immunity induced by CLDN6-presenting MV. (a) Schematic depiction of immunization experiments. (b) IFN-γ ELISpot analysis using splenocytes of vaccinated mice with indicated viruses expressing CLDN6 or MLV-gag. Viruses expressing VLPs, but no antigen (MVvac2-gag) served as negative controls. Splenocytes isolated 21 days after boost immunization and analyzed for IFN-γ-production after incubation with ConA, viral antigen (MV bulk), specific or unspecific peptides (CLDN6 or ISQ, respectively), or without stimulation (mock). (c) Virus neutralizing titers (VNT) of with indicated viruses vaccinated animals’ sera were analyzed for neutralization of MV. LLOD = VNT 20. (d) Flow cytometry histograms of CLDN6-expressing CT26 cells stained with sera of representative mice vaccinated with indicated viruses before (solid black line), after prime (solid grey line), or after booster (filled grey area) vaccination. Staining with anti-CLDN6 mAb served as positive control (e) Analysis of CLDN6-specific antibody concentration in serum samples of vaccinated mice determined by FACS as shown in panel D according to MFI of stained cell populations. Dots represent single animals (n = 5–6); horizontal line represents mean per group. Statistical differences between groups were assessed by Mann-Whitney test (b) or two-way ANOVA (d); *P < 0.05; **P < 0.01; ****P < 0.0001.

