Figure 7.
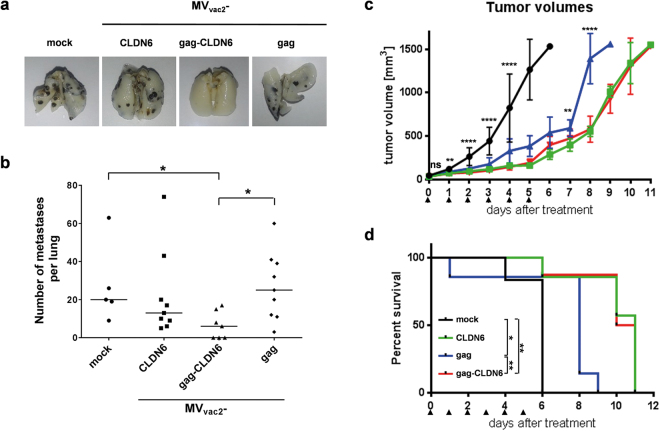
Anti-tumoral efficacy of recombinant viruses. Anti-tumoral efficacy after (a,b) prophylactic vaccination against metastatic spread or (c,d) therapeutic treatment of pre-established tumors. (a) Lungs of representative mice vaccinated twice with indicated viruses or medium (mock), 19 days after tumor-challenge. Lungs were prepared, fixed, and bleached with Fekete’s solution. B16 cell metastases become visible as black dots. (b) Quantitative analysis of metastases per lung after vaccination and B16-challenge. Dots represent number of metastases in individual animals (n = 5–9); horizontal line represents median per group. Statistical differences between groups were assessed by Mann Whitney test. *, P < 0.05. (c) Growth of subcutaneous B16-mCLDN6-hCD46 tumors on the flanks of IFNAR−/−-CD46Ge mice after treatment (arrow heads) with MVvac2-gag (blue), MVvac2-CLDN6 (green), MVvac2-gag-CLDN6 (red), or OptiMEM as mock control group (black). Mean tumor size and SD are indicated. Statistical differences between groups were assessed by one-way ANOVA. ns, non-significant; **, P < 0.01; ****, P < 0.0001. (d) Survival of tumor-bearing animals. Kaplan-Meyer survival plots of animals depicted in (c). Statistical differences between groups were assessed by Log-rank (Mantel-Cox) test. *P < 0.05; **P < 0.01.

