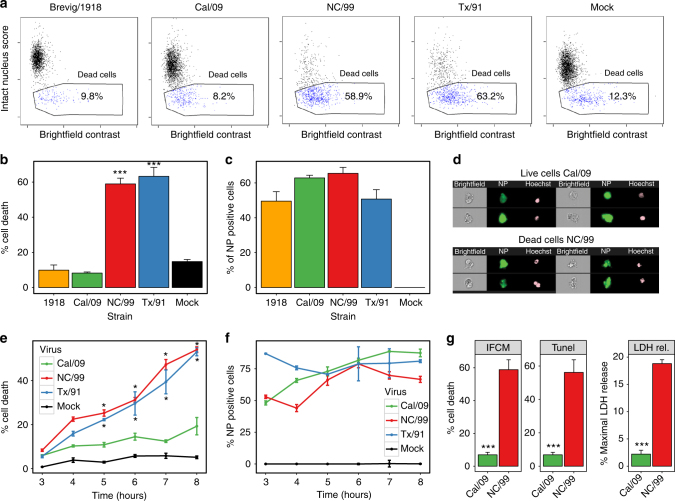
Fig. 1.
Seasonal but not pandemic IAVs induce human DC death. DC were infected for 8 h with either mock or the indicated IAV strains. Cell death was assayed through quantification of nuclear fragmentation and assessment of cell morphology by imaging flow cytometry. The Brevig/1918 and Cal/09 are pandemic IAV strains, whereas the NC/99 and Tx/91 are seasonal IAV strains. a Flow cytometry plots illustrating the percentage of dead cells after DC infection. Percentage of cell death (b) and of NP-positive cells (c) following infection. ***p < 0.001. d Sample images of live cells following Cal/09 infection, and dead cells following NC/99 infection. Data are representative of three independent experiments using DC derived from different donors. n = 3 for experimental groups and for mock-infected controls. Time-course measurements of the percentages of cell death (e) and of the proportion of NP-expressing cells following DC infection (for 3–8 h) (f). *p < 0.005. Data are representative of four independent experiments using DC derived from different donors. n = 3 for experimental groups and for mock-infected controls. g Comparison of the percentage of cell death measurements obtained by imaging flow cytometry (IFCM), TUNEL method, and lactate dehydrogenase release cytotoxicity assay (LDH rel.). Note that the percentage of cell death in untreated cells and in infected cells varies in DC obtained from different individual donors. Data shown in a–g were obtained in DC from three different donors, respectively. ***p < 0.005. This experiment was performed three times. n = 3 technical replicates. b, c, e–g Values shown are median ± s.e.m, ANOVA followed by Tukey’s honest significant difference (HSD) test

