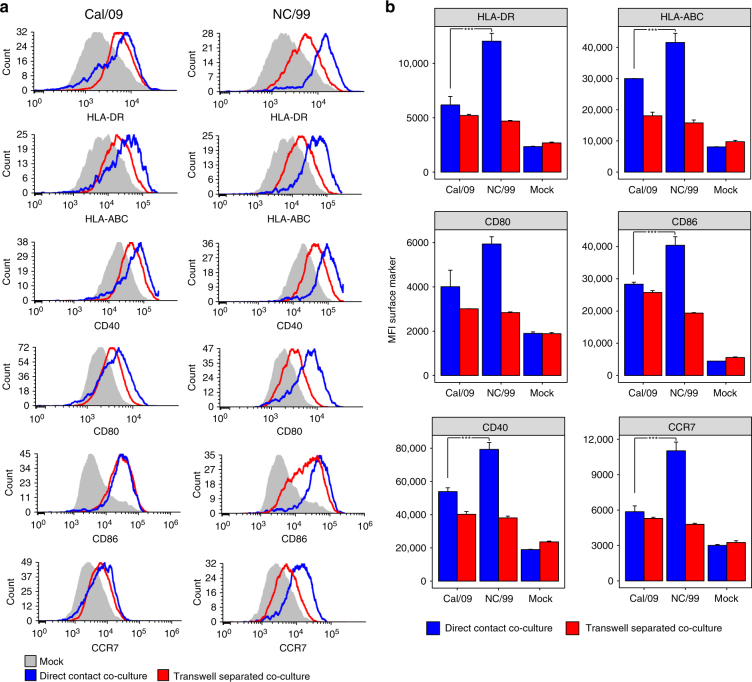
Fig. 5.
Analysis of maturation marker expression in naive DC cocultured with virus-infected DC either directly or in a transwell system. a, b Naive DC were cocultured directly (direct contact coculture) with either Cal/09- or NC/99-infected DC, at a ratio of 1:1. Alternatively, naive DC were cocultured in a transwell system (transwell-separated coculture) with either Cal/09-infected or NC/99-infected DC across the membrane at a ratio of 1:1. Cells were stained 18 h after infection for HLA-DR, HLA-ABC, CD40, CD80, CD86, CCR7, and NP, and analyzed by flow cytometry. Maturation marker expression was measured in NP-negative cells (Supplementary Fig. 7) in order to distinguish between infected and uninfected cells in the direct contact coculture. Mock-infected DC served as a negative control. a shows representative flow cytometry plots; b is a summary plot. Data are representative of three independent experiments using cells from different donors. n = 3 for experimental groups and for controls. ***p < 0.001, ANOVA followed by Tukey’s HSD test, with an additional Bonferroni multiple-testing correction. Values shown are median ± s.e.m

