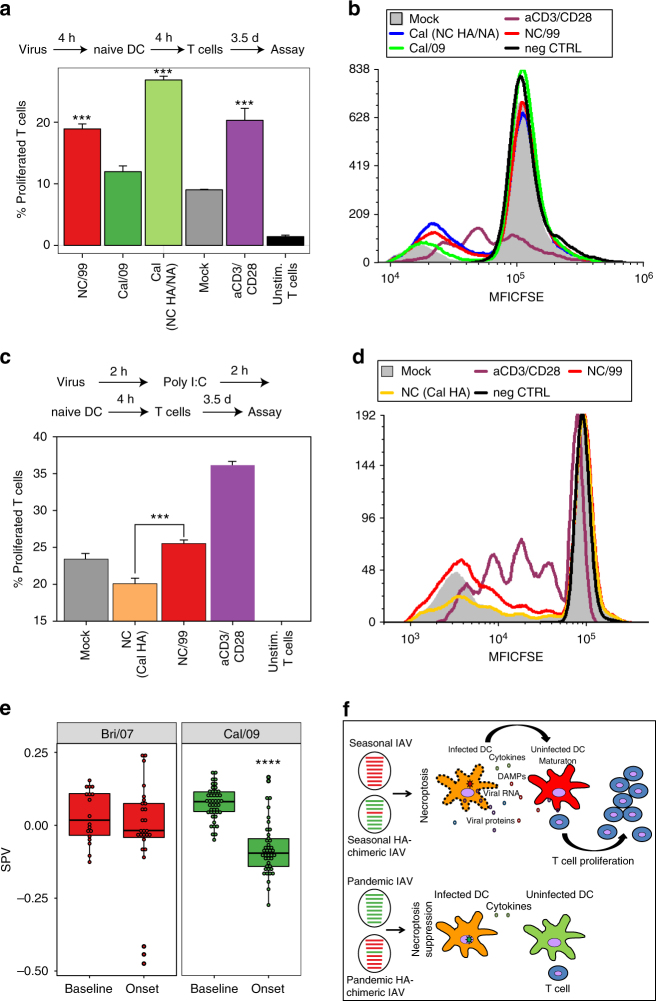
Fig. 7.
Pandemic IAV causes reduced T cell proliferation. a, b DC were either mock-infected or infected with the indicated IAVs for 4 h, cocultured with naive autologous DC for 4 h, and cocultured with CFSE-labeled allogeneic T cells for 3.5 days. c, d DC were either mock-infected or infected with the indicated IAVs for 2 h, transfected with poly I:C (4 μg/ml) for 2 h, cocultured with naive autologous DC for 4 h, and then cocultured with CFSE-labeled allogeneic T cells for 3.5 days. Percentage of proliferated T cells was determined by flow cytometry. T cells incubated with anti-CD3/CD28-coated beads served as a positive control. a, c are summary plots; b, d are representative flow cytometry plots from a replicate. e Blood CD8+ T cell surrogate proportion variables (SPV) following symptomatic seasonal or pandemic IAV infection in humans were determined computationally. For the seasonal Bri/07 infection study, samples from all 9 subjects at two time points before infection (Baseline) were analyzed together; likewise, samples from nine subjects at 45.5, 53, and 60 h after infection (near the peak of influenza-induced symptoms; Onset), were analyzed jointly. Single dots represent individual data points. The three low-value outlier points post infection are from the same subject. Whether the outliers are excluded from the joint analysis, or data at each time point are analyzed separately, the results remain the same as in the joint analysis. The Cal/09 data represent analysis of a single preinfection sample and a single symptom onset sample coming from 45 subjects infected with the influenza virus. f Schematic illustrating the distinct effects of seasonal IAV and seasonal HA–chimeric IAV, as compared to pandemic IAV and pandemic HA–chimeric IAV, on the induction of necroptosis in infected DC, the subsequent maturation of uninfected DC, and its impact on T cell proliferation/activation. DAMPs, danger-associated molecular patterns. a–e Data are representative of three independent experiments using cells from different donors. n = 3 for experimental groups and for controls. ***p < 0.001, ANOVA followed by Tukey’s HSD test, with an additional Bonferroni multiple-testing correction for summarized data; ****p < 10−13, F-test. Values shown are median ± s.e.m

