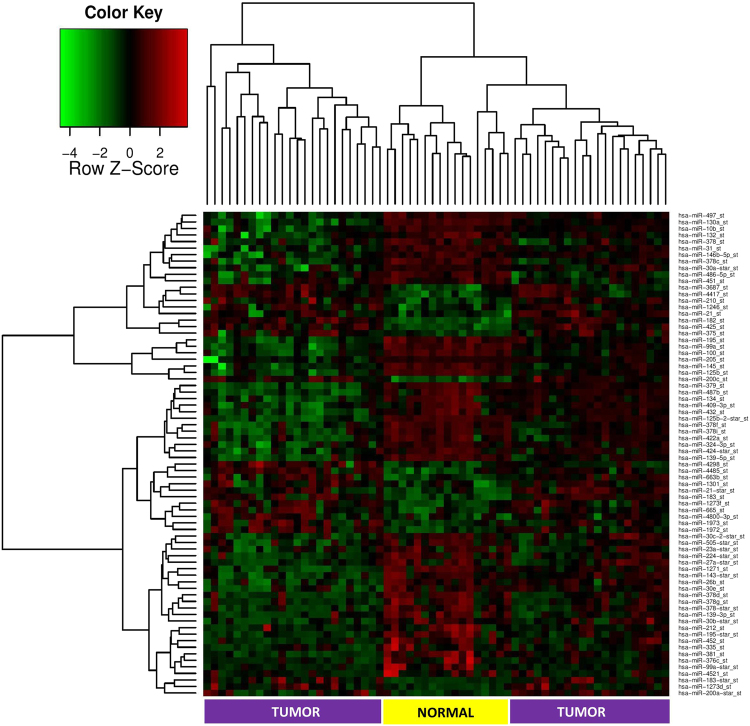
Figure 1.
Heatmap of differentially expressed miRNA in tumor versus normal adjacent breast tissues taken from Lebanese patients. (Fold Change >2 and adjusted p-value < 0.05). Each row represents a differentially expressed miRNA and each column represents one of the 62 samples. The color key shown at the top left illustrates the relative expression level of a miRNA across all samples. A total of 74 miRNA were differentially expressed with separate clustering of tumor and normal adjacent tissues.

