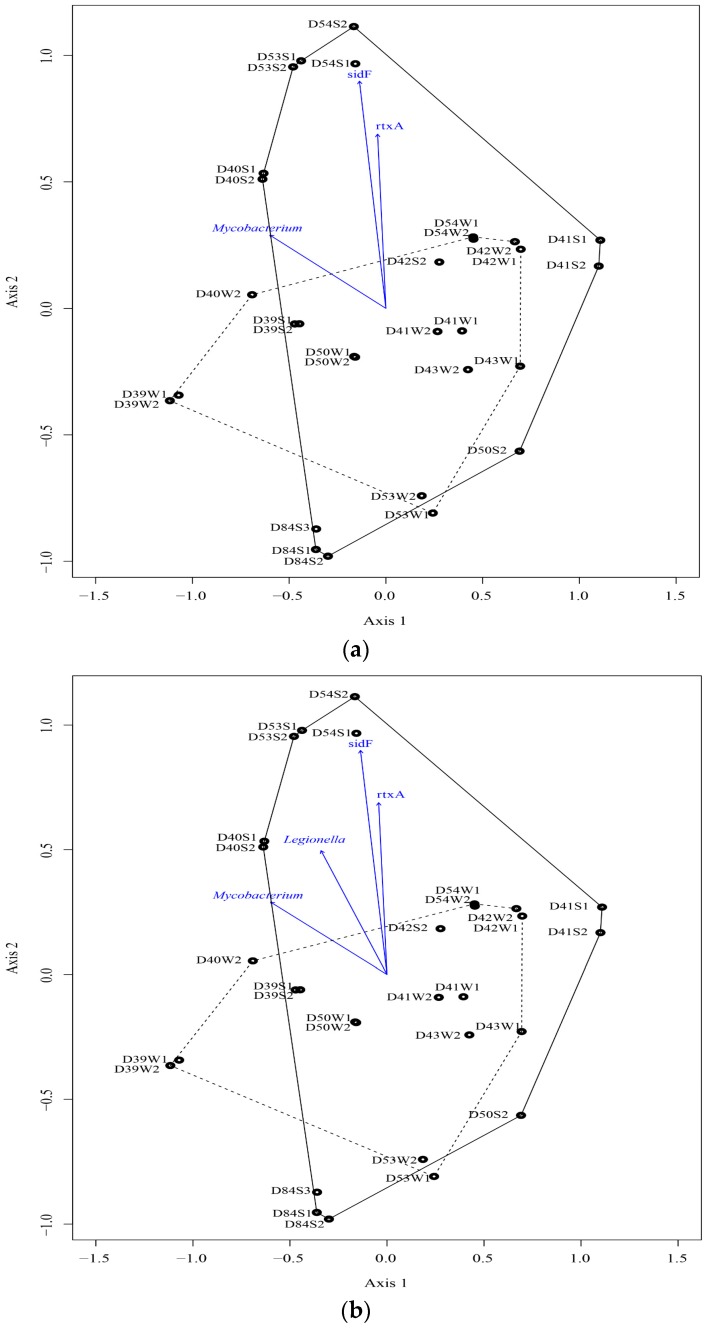
Figure 3.
Nonmetric multidimensional scaling (NMDS) of paired water (W) and sediment (S) samples (Ohio: D39-42, West Virginia: D43, and Texas: D50, D53, and D54) based on microbial community structures with operational taxonomic unit (OTU) numbers and relative abundance of each OTU against relative abundance of elements and opportunistic pathogen densities by qPCR at significant level 10% (a) and 5% (b). The solid circles represent the central tendency of all OTUs detected in each sample from the sediment and water samples, respectively. Symbols that are closer to each other with a dash circle depict samples that contain similar taxa detected by the sequencing. A biplot is overlaid on the ordination to identify environmental parameters that were correlated with the microbial community structure. The length of the line corresponds to the degree of the correlation.

