Figure 4.

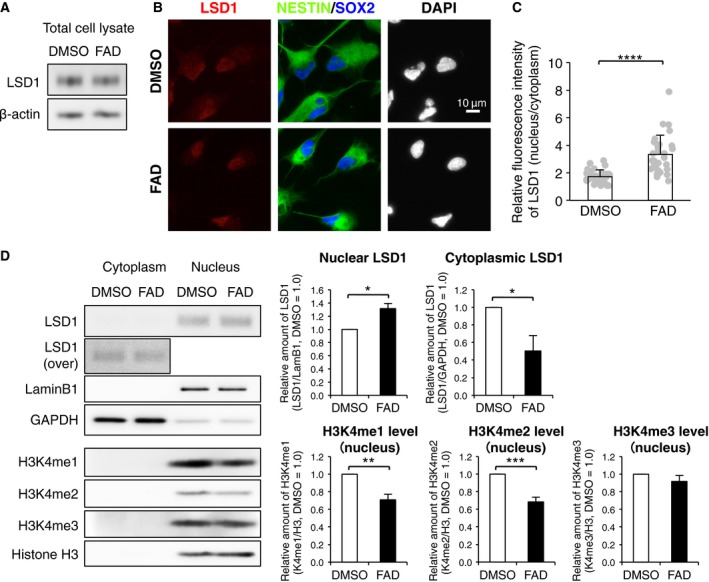
FAD facilitates the nuclear localization of LSD1 in hfNSCs. (A) Western blot analysis of LSD1 expression in FAD‐treated hfNSCs. (B) The cells treated with or without FAD for 24 h were stained with antibodies against LSD1 (red), NESTIN (green), and SOX2 (blue). Insets: Hoechst nuclear staining of each field. Scale bar: 10 μm. (C) Quantification of the ratio of fluorescence intensity of nuclear LSD1 to that of cytoplasm. The values represent the means ± SD. (N = 30, t‐test, ****P < 0.001). (D) Western blot analysis of LSD1, H3K4me1, H3K4me2, and H3K4me3 in nuclear and cytoplasmic extracts of hfNSCs after FAD treatment for 24 h. Lamin B1 and GAPDH are used as nuclear and cytoplasmic fraction markers, respectively. In the graphs, the values of nuclear and cytoplasmic LSD1 derived from ImageStudio Digits were normalized by lamin B1 and GAPDH, respectively. The values of methylated histone were normalized by histone H3. The relative amounts are the means ± SE compared with those for DMSO treatment. (N = 3, t‐test, *P < 0.05, **P < 0.01, ***P < 0.005).
