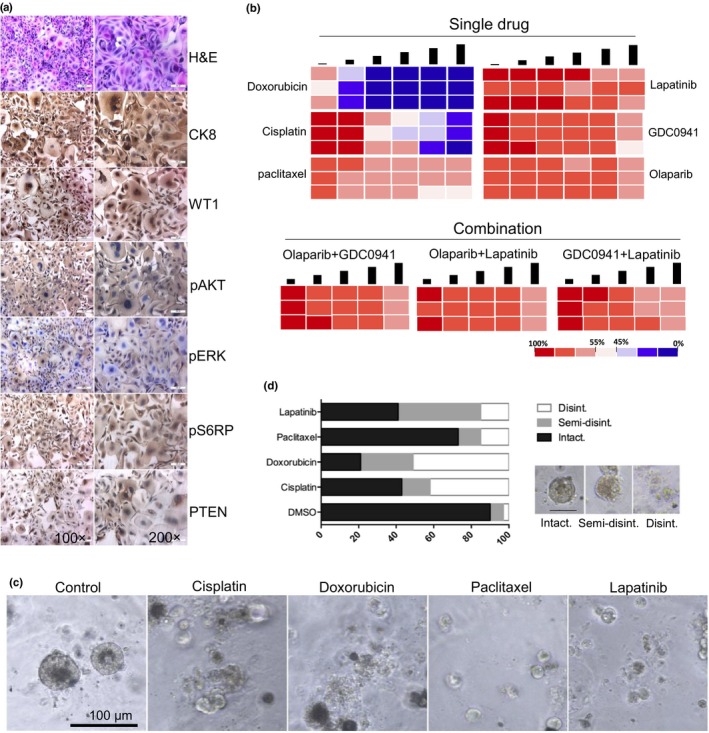
Figure 2.

Representative images and drug sensitivity of cultured ascites‐derived tumor cells from a 62‐year‐old woman with endometrial cancer and breast cancer. (a) Representative images of H&E and immunohistochemistry staining. CK8, cytokeratin 8; pS6RP, phosphorylated S6 ribosomal protein; PTEN, phosphatase and tensin homolog; WT1, Wilms’ tumor suppressor gene 1. (b) Heat maps representing cell viability after treatment of selected anticancer drugs. Each concentration represents a twofold increase from the previous dose, with each concentration tested in triplicate. Conditions were optimized for highly repeatable testing of viability. (c) Ascites‐derived tumor cells were grown in 3‐D culture and treated with indicated drugs. Over 25 structures were scored for each drug. (d) Representative images of scored structures: intact, semi‐disintegrated, and disintegrated (Disint.).
