
Figure 8.
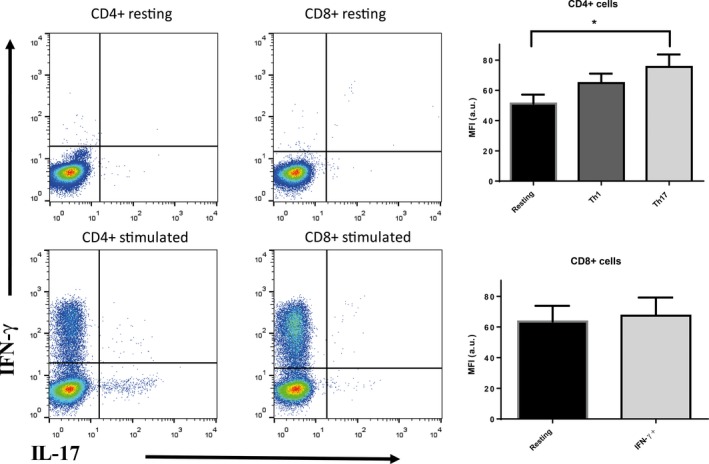
Left: representative flow cytometry plots showing the gating strategy for IFN‐γ and IL‐17 staining in PHA‐M/PMA:ionomycin activated CD4+ and CD8+. Right: median fluorescence intensity (MFI in arbitrary units, a.u.) of GPR61 immunoreactivity represented as mean ± SEM, n = 6; *P < 0.05, one‐way ANOVA with Dunnett's post‐test. The differences in preimmune sera immunofluorescence in these cell subsets were not significantly different (not shown).