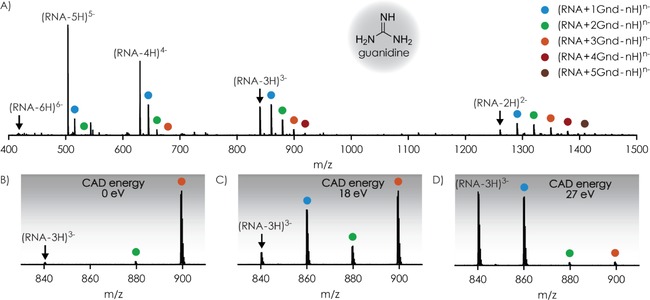
Figure 1.

Mass spectra from A) ESI of a 1 μm RNA solution in 1:1 H2O/CH3OH with 100 μm guanidine at pH≈7.5, B) isolation of [RNA+3 Gnd−n H]n− ions, and subsequent CAD at C) 18 and D) 27 eV laboratory‐frame energy; colored circles indicate the number of Gnd ligands bound to the 8‐nt RNA.
