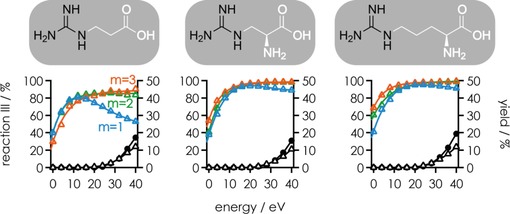
Figure 2.

Fraction of products from Reaction (III) out of all products from Reactions (II) and (III) (left axes) in CAD of [RNA+m L−4 H]4− ions for m=1 (blue), m=2 (green), and m=3 (orange) for Gpa, aGpa, and Arg (corresponding ligand structures with the guanidine moieties highlighted in black are shown on top) versus laboratory‐frame energy. Also shown are yields (right axes) of c, y (up to 13.5 %) and a, w (up to 3.5 %) fragments including those that showed nucleobase loss (black circles), and products of nucleobase loss from [RNA+L−4 H]4− ions (black triangles) in CAD of [RNA+L−4 H]4− ions.
