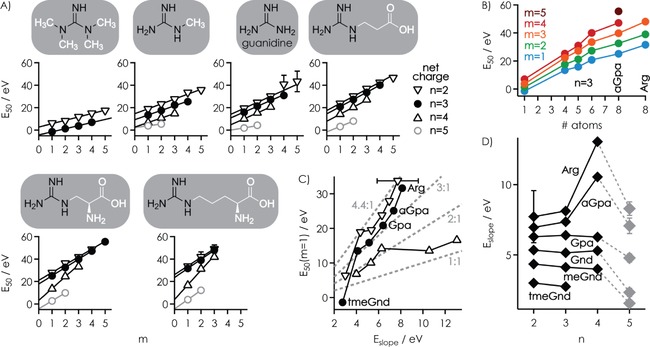
Figure 4.

A) E 50 values for the dissociation of all ligands by CAD of [RNA+m L−n H]n− complex ions with n=2–5 versus the total number of ligands m (corresponding ligand structures with the guanidine moieties highlighted in black on top), B) E 50 values for n=3 versus the number of atoms that can potentially be involved in hydrogen‐bond or salt‐bridge interactions with the RNA for m=1–5, C) E 50 values at m=1 versus slope values E slope from linear‐fit functions in (A) for n=2–4; the dashed lines indicate E 50(m=1)/E slope 1:1, 2:1, 3:1, and 4.4:1, D) E slope versus complex net charge n (values at n=5 are shown in gray to highlight a systematic decrease in the values of E slope).
