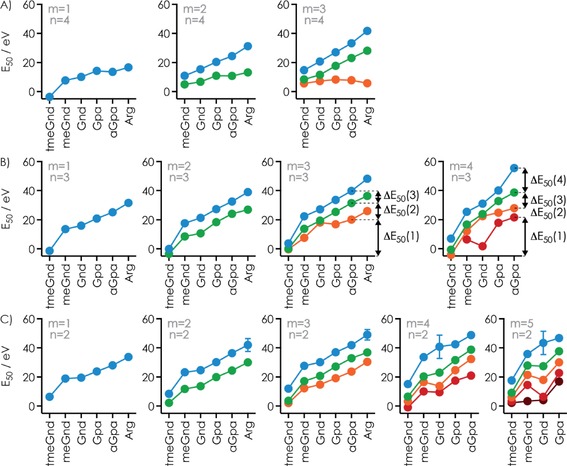
Figure 5.

A) E 50 values for the sequential dissociation of individual ligands (blue: ligand m, green: ligand m−1, orange: ligand m−2, red: ligand m‐3, brown: ligand m−4) in CAD of [RNA+m L−n H]n− complex ions with m=1–5 and A) n=4, B) n=3, and C) n=2; ΔE 50 values for the sequential dissociation of individual aGpa ligands at n=3 and m=3 and 4 are indicated by arrows.
