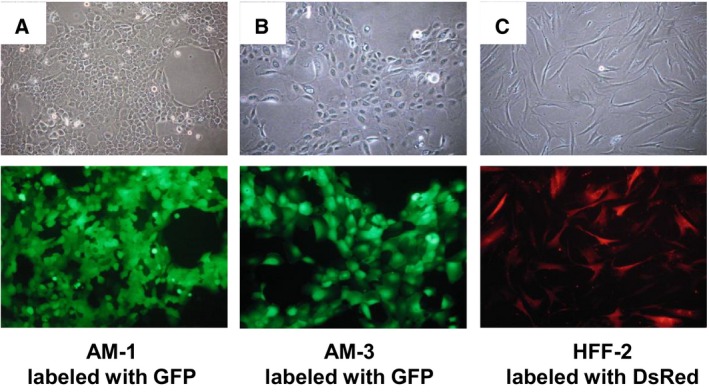
Figure 3.

The images of ameloblastoma and fibroblast cell lines. AM‐1 plexiform (A) and AM‐3 follicular (B) ameloblastoma cells were labeled with GFP. (C) HFF‐2 fibroblasts were labeled with DsRed. Upper panels: phase‐contrast images. Lower panels: fluorescent images.
