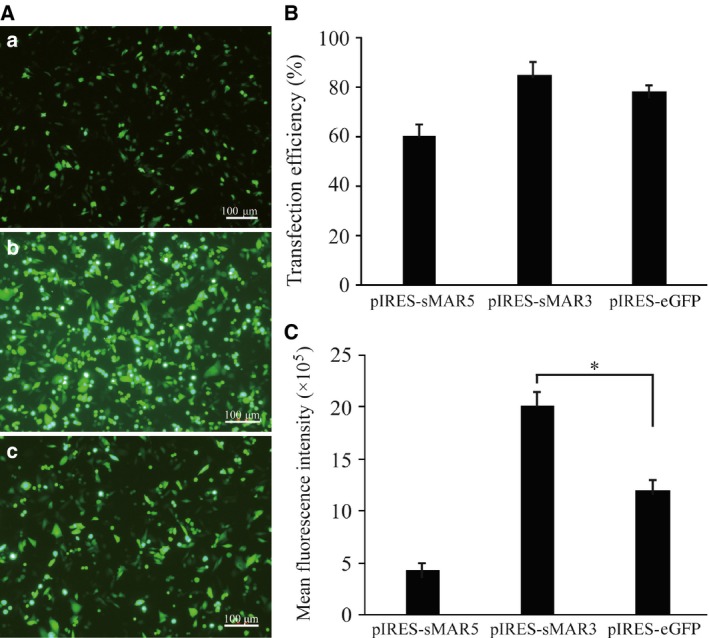
Figure 2.

Fluorescence microscopy of eGFP gene in transfected CHO cells after 48 h of transfection. (A) Micrograph of cells transfected with pIRES‐sMAR5 vectors (a), pIRES‐sMAR3 (b) vectors, and pIRES‐eGFP vectors (c). (B) Cell transfection efficiency was detected using eGFP antibody by flow cytometry. (C) Meanwhile, the transient expression levels of eGFP were obtained (*P < 0.05).
