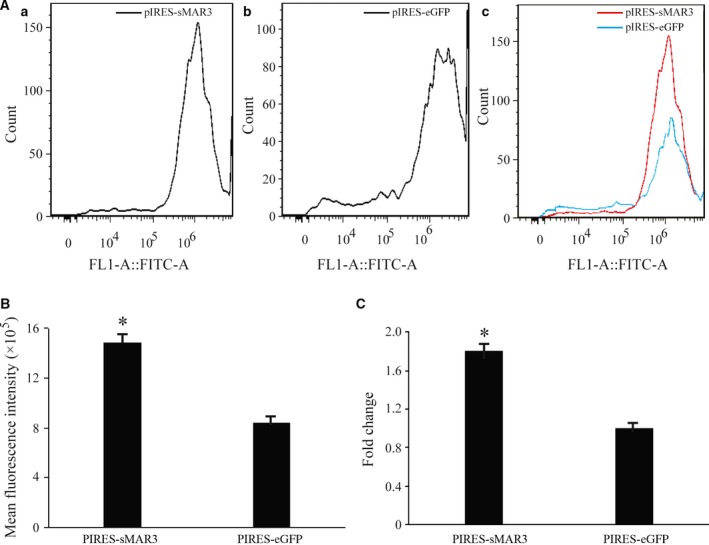
Figure 3.

Analysis of the stable transgene eGFP expression. Cells were collected under G418 screening at day 20 post‐transfection. (A) Micrograph of cells that express different eGFP expression levels and transfected with pIRES‐sMAR3 vector (a) and pIRES‐eGFP vector (b). And the cell counts at different eGFP expression levels were compared (c). B) Flow cytometric analysis of transgene eGFP expression. After 20 days of transfecting vectors, recombinant protein expression stability was tested using flow cytometric analysis. The eGFP expression level was represented by the MFI. (C) The fold change of eGFP expression levels in cells transfected with pIRES‐sMAR3 and pIRES‐eGFP vectors was calculated (*P < 0.05).
