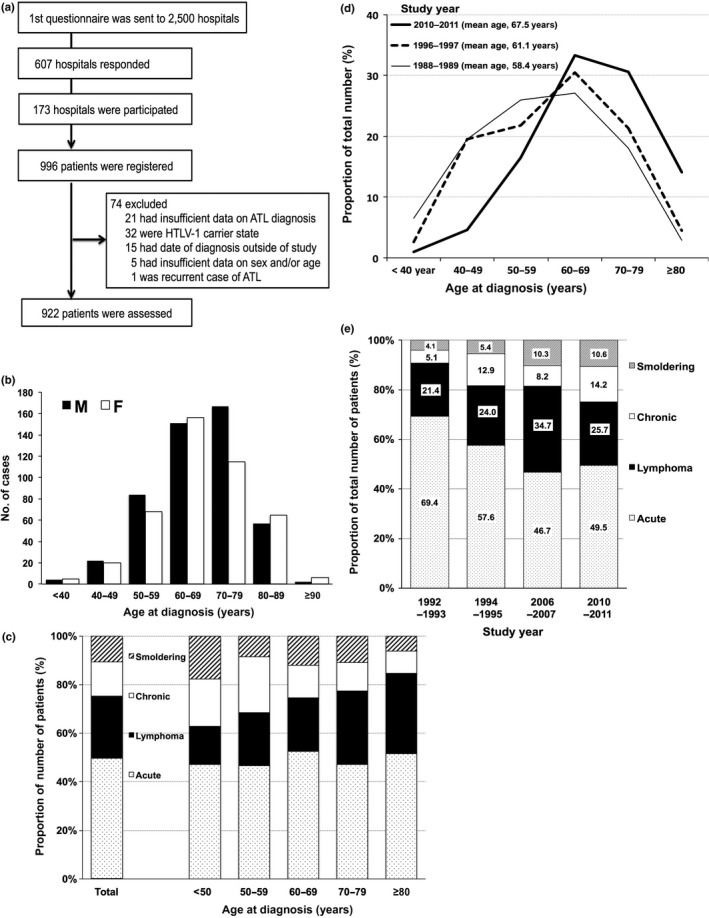
Figure 1.

(a) Flowchart of the study of epidemiological and clinical features of adult T‐cell leukemia–lymphoma (ATL) in Japan, 2010–2011. HTLV‐1, human T‐cell leukemia virus type 1. (b) Distribution of age at diagnosis by sex. F, female; M, male. (c) Distribution of age at diagnosis by ATL subtype based on the central reviewers’ classification based on the Shimoyama classification.19 (d) Changes in the proportion of patients in each age category from years 1988–1989,14 1996–1997,18 to 2010–2011 (current study). (e) Changes in the proportion of ATL subtype from years 1992‐1993,16 1994‐1995,17 2006–2007,20 to 2010–2011 (current study).
